Crypto Revenue Metrics: How Chains Earn
Learn the key crypto revenue metrics used to analyze blockchain apps and chains, including total fees, protocol revenue, earnings and more.
Author: Chirag Sharma
Most people track cryptocurrency markets using simple indicators such as price, trading volume, or total value locked (TVL). These metrics are useful for measuring market interest, but they do not explain how a blockchain or decentralized application actually generates economic value. To understand the real business model behind a protocol, analysts rely on crypto revenue metrics.
Platforms like Token Terminal and DefiLlama have helped standardize these metrics across the industry. Their dashboards break down blockchain activity into financial categories that resemble traditional accounting. In traditional companies you would analyze revenue, costs, and profit. Crypto ecosystems follow a similar structure, although the terminology differs slightly.
Revenue
Gross profit
Dividends
Net profit
These metrics allow investors and analysts to evaluate protocols in the same way they would evaluate technology companies or financial institutions.
Understanding crypto revenue metrics also helps answer several important questions:
- Which protocols are generating real economic activity?
- Which blockchains are capturing the most value from their ecosystems?
- Which tokens actually benefit from the usage of their networks?
Without these metrics, it is difficult to distinguish between hype-driven projects and protocols that generate sustainable economic value.
The rest of this guide explains the major types of revenue tracked in the blockchain ecosystem and how each metric helps investors understand the financial health of crypto networks.
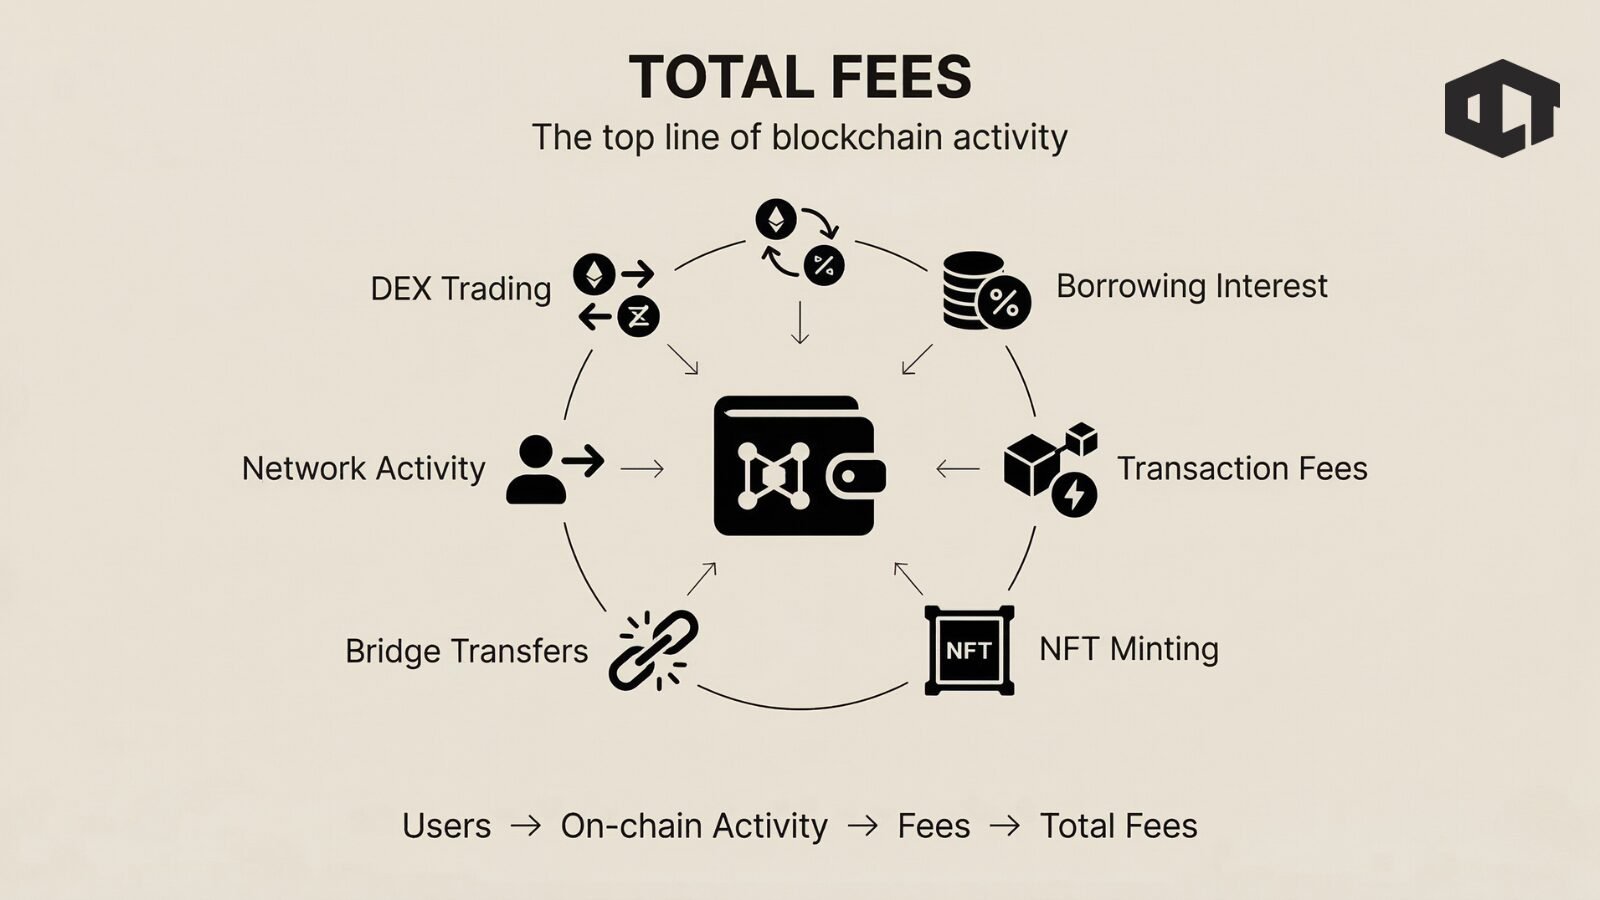
Total Fees: The Top Line of Blockchain Activity
The most basic metric in blockchain analytics is total fees.
Total fees represent the full amount of money users pay to interact with a blockchain network or decentralized application. This includes every fee generated by transactions, trading, borrowing, or other on-chain activities.
In traditional finance terms, this is similar to gross revenue or the total economic activity generated by a product.
Whenever users perform an action on a blockchain, they typically pay a fee for that interaction. These payments accumulate into the total fee metric.
Common sources of total fees include:
- Trading fees on decentralized exchanges
- Interest paid by borrowers in lending protocols
- Transaction or gas fees on blockchains
- NFT minting costs
- Bridge and cross-chain transfer fees
For example, when someone swaps tokens on Uniswap, the user pays a trading fee that contributes to the protocol’s total fees. When users send transactions on Ethereum or Solana, the gas or transaction fee becomes part of the network’s total fee activity.
Total fees are often described as the GDP of a blockchain ecosystem because they represent the total economic activity taking place on that network.
If a protocol consistently generates high total fees, it usually means the platform has strong user demand. Traders are actively swapping assets, borrowers are taking loans, or users are paying for network access.
However, total fees alone do not reveal how much money the protocol actually keeps.
Most blockchain systems distribute the majority of these fees to other participants such as liquidity providers, validators, or lenders. Because of this, analysts must go deeper to understand how much value the application itself retains.
That is where the next metric becomes important.
App Revenue: What the Protocol Actually Keeps
While total fees represent the overall economic activity of a protocol, app revenue, often called protocol revenue, represents the portion that the application itself retains. This is one of the most important crypto revenue metrics because it shows how much income the protocol generates for its treasury or token holders. In many decentralized finance systems, the majority of fees are distributed to users who provide liquidity or capital. The protocol keeps only a small percentage called the take rate.
The formula is simple:
Protocol Revenue = Total Fees × Take Rate
For example, a decentralized exchange might charge a 0.30 percent trading fee. Liquidity providers may receive 0.25 percent of that fee while the protocol keeps 0.05 percent. That retained portion becomes the protocol’s revenue.
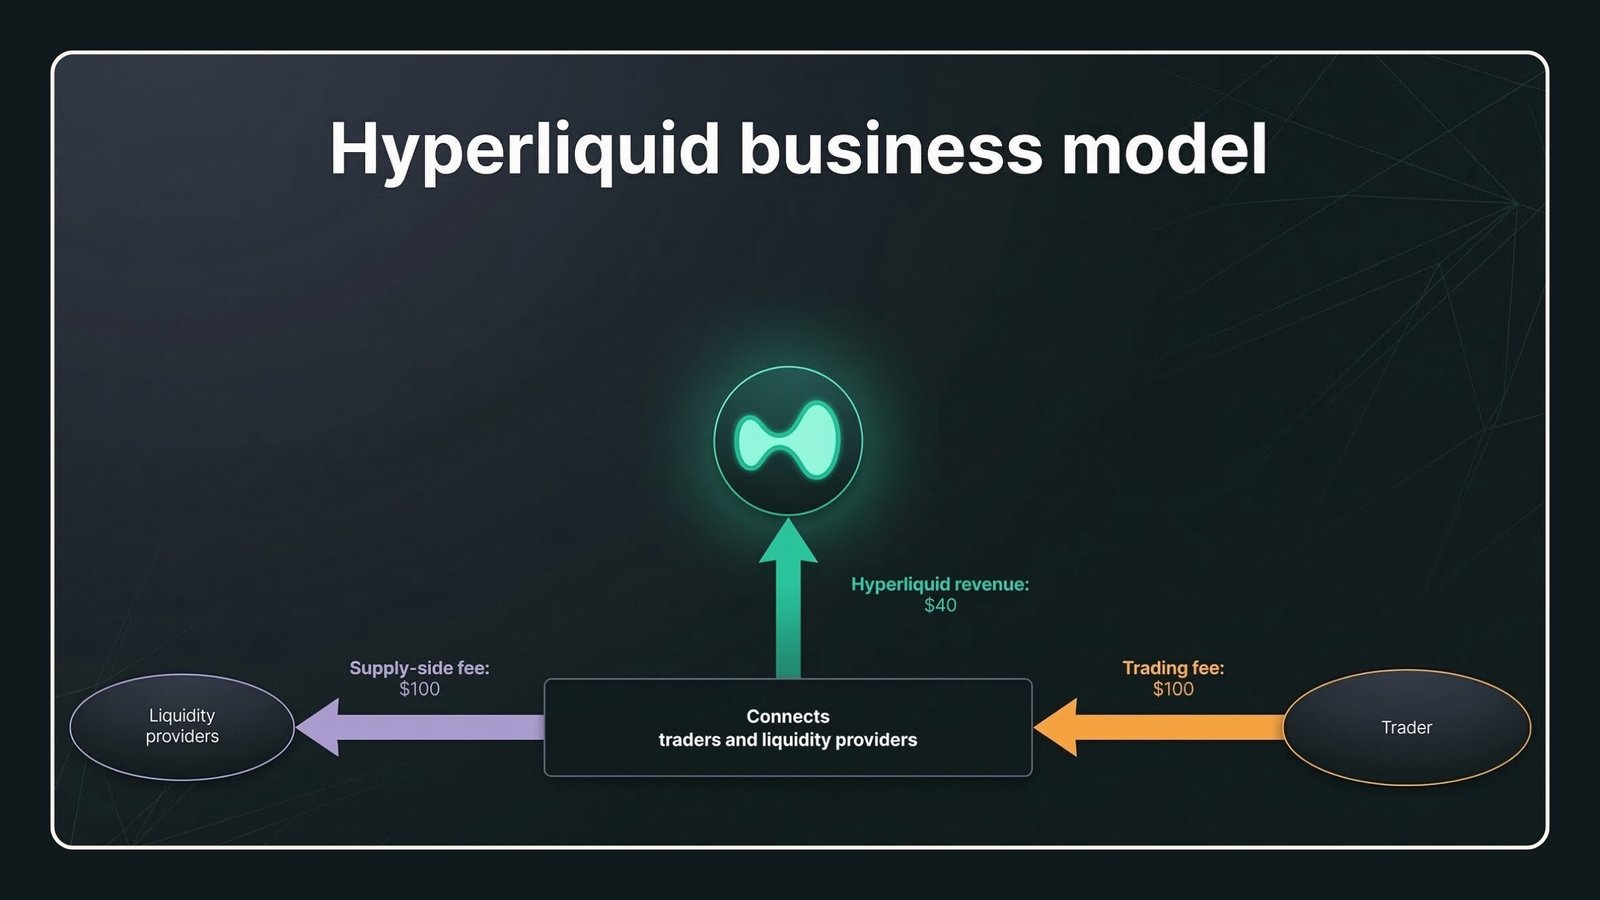
Several well-known crypto platforms generate significant app revenue using this model. For instance, derivatives trading protocol Hyperliquid earns revenue from trading fees on leveraged positions.
Launch platforms such as Pump.fun collect fees whenever users create or trade new tokens. Other protocols like Aerodrome capture a portion of trading activity within their ecosystem.
Protocol revenue usually flows into a treasury that funds the long-term development of the project. These funds may be used for several purposes.
Common uses include:
- paying developers and contributors
- funding ecosystem grants
- building infrastructure or new features
- executing token buybacks or burns
Because this metric reflects the money actually retained by a protocol, analysts often use it when valuing blockchain projects. Some investors compare token market capitalization to protocol revenue in the same way traditional analysts compare stock price to company revenue. This approach helps determine whether a protocol is generating enough economic activity to justify its valuation.
However, even protocol revenue does not tell the full story. Some blockchain networks also generate revenue at the infrastructure level, separate from the applications built on top of them. Understanding this distinction between app-level and chain-level revenue is essential when analyzing crypto ecosystems.
Chain Revenue: How Blockchains Capture Value
When people analyze crypto revenue metrics, they often focus only on applications such as exchanges, lending protocols, or launch platforms. However, the blockchain itself can also generate revenue. This is known as chain revenue.
Chain revenue refers to the portion of fees retained by the underlying blockchain infrastructure. It measures how much value the base layer earns from the activity happening across its network. Whenever users submit transactions, they pay fees to the chain. Those fees are typically distributed to validators or sequencers who secure the network and process transactions.
Each blockchain captures revenue differently depending on its architecture.
For a Layer 1 chain, chain revenue typically comes from transaction fees paid by users interacting with the network. Validators receive a portion of those fees for including transactions in blocks and maintaining network security. Layer 2 networks follow a slightly different model. These networks bundle transactions off-chain and periodically submit compressed data back to the base layer. The L2 may charge its own transaction fees, while also paying data availability costs to the Layer 1 chain.
These are the Layer-1 revenue across chains in March 2026
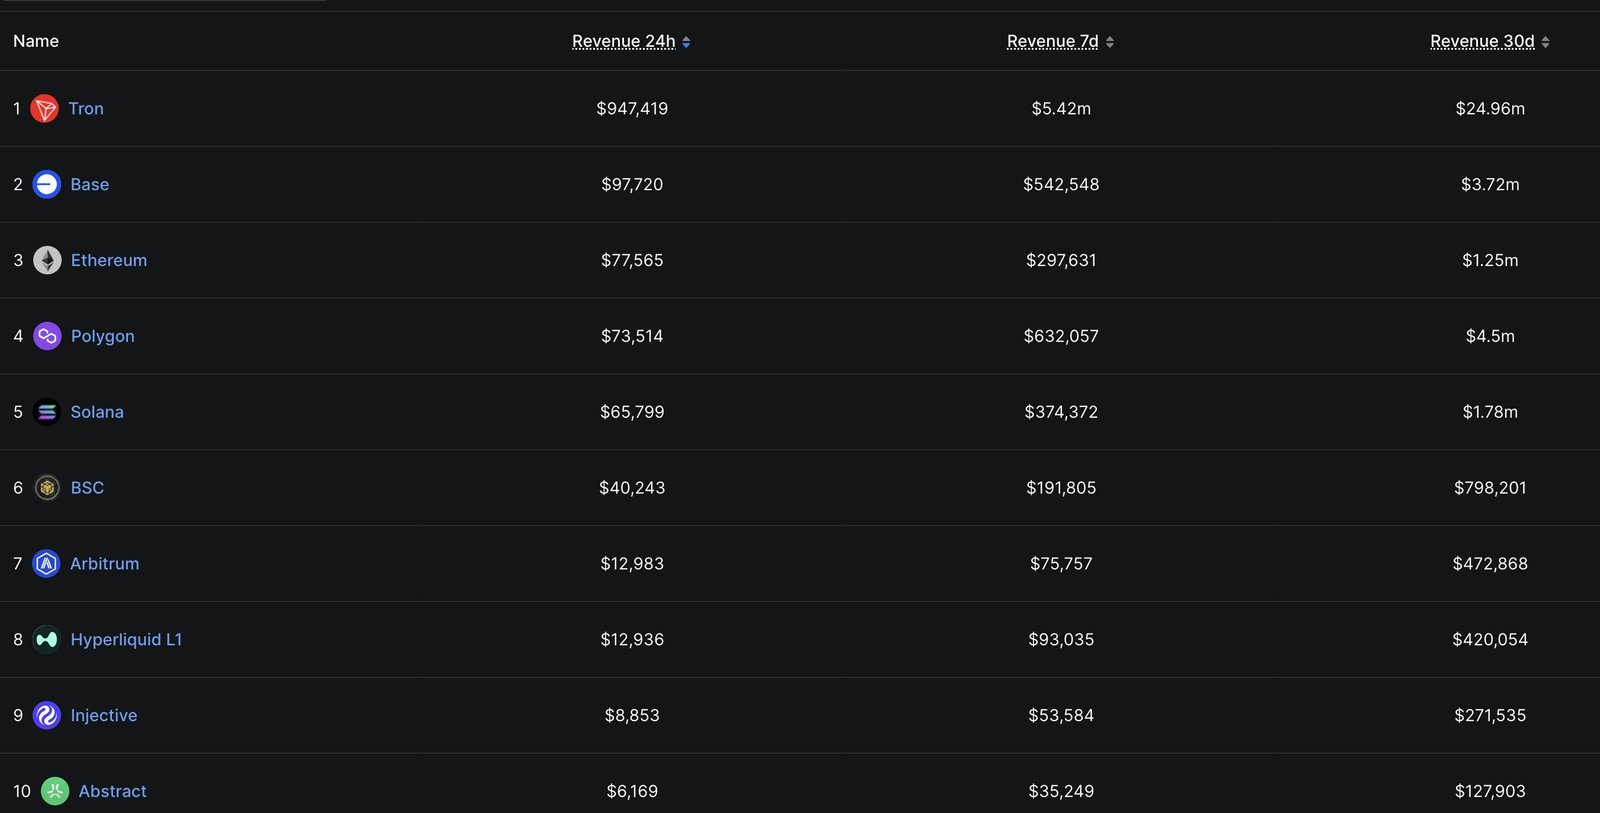
Because of this structure, analysts often track two separate metrics for Layer 2 ecosystems:
- the revenue earned by the Layer 2 network itself
- the fees that Layer 2 pays to the underlying Layer 1 chain
This distinction has become increasingly important as Layer 2 networks continue to grow.
For example, rollups such as Arbitrum and Base can generate significant chain revenue through sequencer operations. The sequencer acts as the transaction ordering system for the network and collects fees from users. These fees represent the infrastructure earnings of the chain.
When analysts compare blockchain ecosystems, chain revenue helps measure how valuable the network itself has become. If a chain consistently generates high transaction revenue, it suggests strong demand for its infrastructure. However, chain revenue only captures one part of the overall financial picture. Many blockchain applications distribute most of their fees to users who provide capital or liquidity. These payments form another major category within crypto revenue metrics.
Supply-Side Revenue: The Incentives That Power DeFi
Decentralized finance relies heavily on user participation. Protocols need liquidity providers, lenders, stakers, and validators in order to function properly. To encourage this participation, they distribute a large portion of collected fees back to users. This distribution is known as supply-side revenue.
Supply-side revenue represents the share of total fees paid to participants who supply capital or security to the protocol. In other words, it is the money that flows back to the ecosystem participants rather than remaining with the protocol itself.
Some common examples include:
- Liquidity provider earnings
- When users provide liquidity to a decentralized exchange such as Uniswap, they receive a share of the trading fees generated by swaps on that pool. These earnings compensate them for providing capital and absorbing trading risk.
- Lending interest
- On lending platforms such as Aave, borrowers pay interest on their loans. That interest is distributed to lenders who supplied the capital used for the loans.
- Staking rewards
- Many blockchains reward validators and stakers with a share of transaction fees or newly issued tokens. This encourages participants to secure the network.
Supply-side revenue is often the largest portion of total fees in many DeFi protocols. For example, a decentralized exchange may distribute the majority of its trading fees directly to liquidity providers while retaining only a small percentage as protocol revenue. Because of this structure, high total fees do not necessarily mean the protocol itself is highly profitable. A large portion of the economic activity may be flowing back to users rather than to the protocol treasury.
Understanding this distribution helps analysts interpret revenue metrics correctly. A protocol generating $100 million in total fees might retain only $10 million in actual protocol revenue if the rest is distributed to liquidity providers. This difference between total fees and retained revenue is one of the most important insights that crypto revenue metrics provide.
Holder Revenue: Value Accruing to Token Owners
Another important category within crypto revenue metrics is holder revenue.
Holder revenue represents the portion of protocol earnings that directly benefits token holders. It functions similarly to dividends or stock buybacks in traditional financial markets. Some protocols share a portion of their revenue with token holders through various mechanisms.
These mechanisms can include:
- Token buybacks :The protocol uses part of its revenue to purchase its native token from the market. This reduces circulating supply and can increase the value of remaining tokens.
- Token burns : Certain blockchains permanently destroy a portion of transaction fees. For example, part of Ethereum’s gas fees is burned, reducing the total supply of ETH over time.
- Revenue sharing : Some protocols distribute a portion of trading or lending fees directly to token stakers.
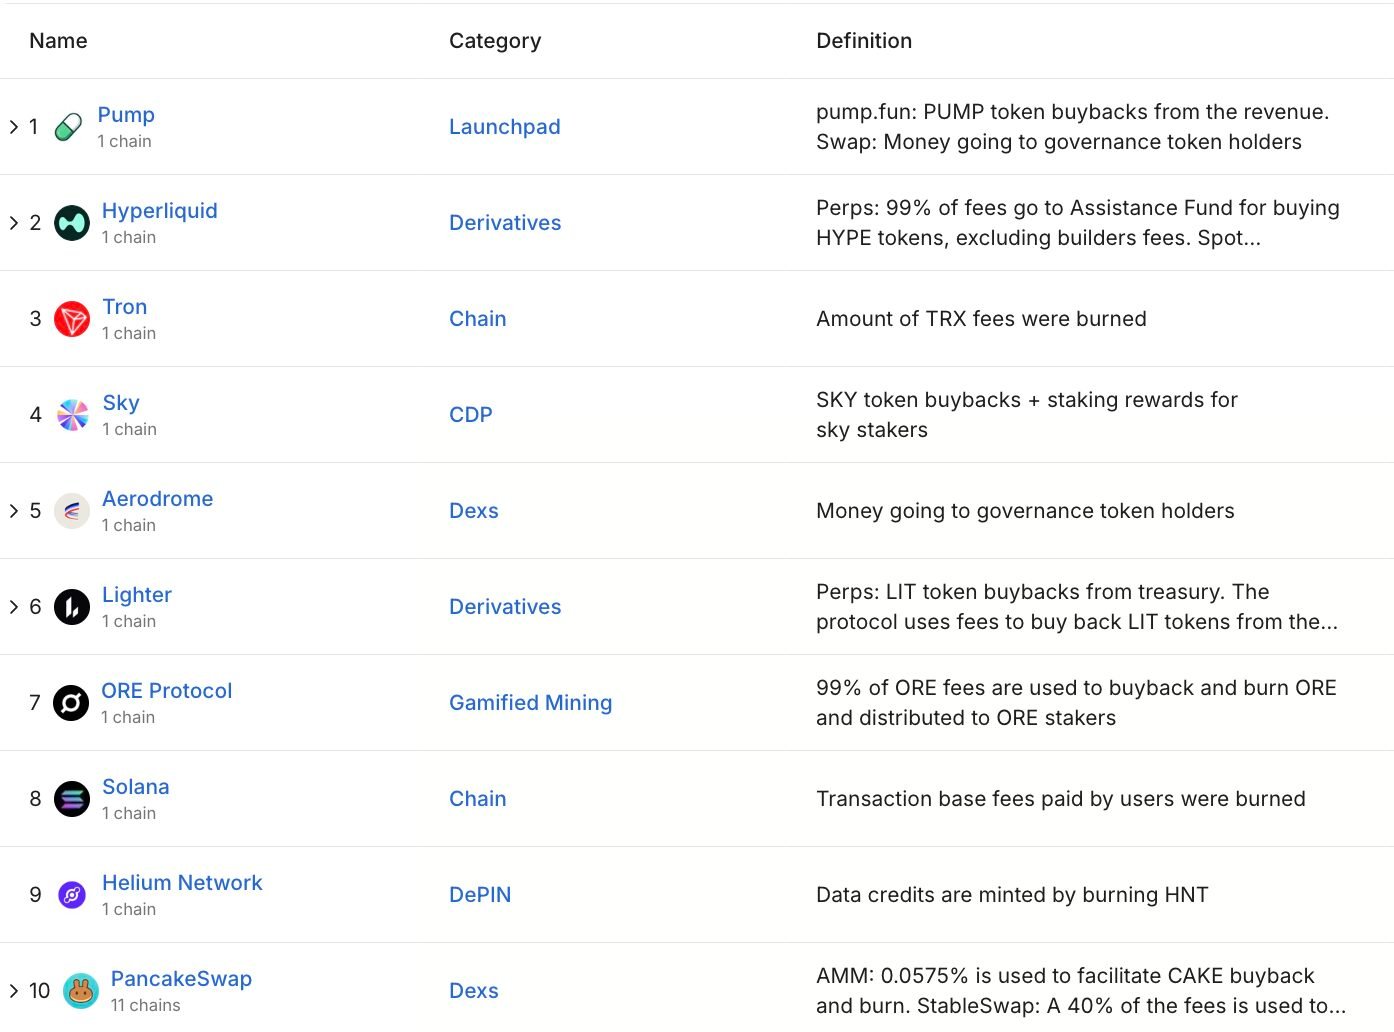
These mechanisms create direct economic alignment between the success of the protocol and the value of its token.
If a protocol generates significant revenue and shares it with token holders, the token becomes more similar to an equity asset that benefits from the growth of the network. Analytics platforms like DefiLlama often track holder revenue as a separate metric alongside total fees and protocol revenue. This allows investors to understand how much value actually accrues to the token itself rather than remaining within the protocol treasury.
For token investors, this distinction is critical. A protocol might generate large amounts of revenue, but if none of that revenue flows to token holders, the token may not capture the value created by the network.
Earnings: Measuring True Profitability
So far we have looked at several layers of crypto revenue metrics. Total fees measure economic activity. Protocol revenue shows how much the application retains. Supply-side revenue shows what users earn. Chain revenue measures infrastructure earnings. However, none of these metrics alone reveal whether a protocol is actually profitable. That is where earnings come in.
Earnings represent the bottom-line profitability of a protocol or blockchain after accounting for its costs. In traditional financial terms, this is equivalent to net profit.
The formula generally looks like this:
Earnings = Protocol Revenue − Costs
Costs can include several on-chain and operational expenses. Some of these are visible directly on the blockchain, while others may exist off-chain.
Common cost categories include:
- data availability fees paid by Layer 2 networks to their base layer
- token incentives used to attract liquidity or users
- validator rewards funded by the protocol
- operational spending such as development and infrastructure
Layer 2 networks provide a good example of why earnings matter.
A rollup might generate significant chain revenue from user transactions. However, the rollup must also pay data availability costs to the Layer 1 chain where it publishes its transaction data. These payments can be substantial. If the chain revenue exceeds those costs, the rollup produces positive earnings. If not, the network may still rely on subsidies or token incentives. Because of this, earnings provide the clearest picture of a protocol’s financial sustainability. Investors often look at this metric to determine whether a network is building a viable long-term business model.
Platforms like Token Terminal frequently highlight earnings when comparing blockchain ecosystems.
Supply-Side Revenue
Holder Revenue
Earnings
Other Specialized Revenue Categories
The crypto ecosystem evolves quickly, and new revenue categories continue to emerge. While the main metrics discussed earlier cover most activity, analysts sometimes track additional niche revenue streams.
These specialized metrics help provide deeper insight into how value flows through blockchain networks. One of the most widely discussed examples is MEV revenue.
Do checkout this video from Whiteboard Crypto on MEV
MEV stands for maximum extractable value. It represents profits that validators or block builders can extract by reordering transactions within a block. On networks such as Ethereum, specialized infrastructure has developed around MEV extraction. Builders and searchers compete to capture arbitrage opportunities, liquidation profits, or other transaction ordering advantages. Another category involves bridge and cross-chain revenue.
As assets move between blockchains, bridging protocols often charge fees for facilitating these transfers. These fees accumulate into the protocol’s total revenue and may be distributed to validators or liquidity providers. Stablecoin issuers represent another unique revenue model.
Companies behind large stablecoins generate income from the reserves backing their tokens. When users hold stablecoins such as USDT or USDC, the issuing companies invest the underlying reserves into interest-bearing assets. The interest generated from those reserves becomes the issuer’s revenue.
There are also category-specific fee structures across different sectors of the crypto economy.
Examples include:
- trading fees from decentralized exchanges
- lending spreads from lending markets
- NFT royalties from digital asset marketplaces
- launchpad fees from token issuance platforms
Although these revenues originate from different activities, analytics platforms usually group them into the broader metrics we discussed earlier such as total fees, protocol revenue, or supply-side revenue.
How Investors Use Crypto Revenue Metrics
Crypto revenue metrics are not just academic concepts. They play an important role in how investors evaluate blockchain projects. By analyzing revenue data, investors can compare protocols across different sectors and determine which networks generate real economic activity.
One common approach involves comparing a protocol’s market value to its revenue generation. Traditional investors use ratios such as price-to-earnings or price-to-sales when evaluating stocks. Crypto analysts often apply similar frameworks.
Two commonly used ratios include:
- price-to-revenue ratios
- price-to-fees ratios
If a protocol has a large market capitalization but generates little revenue, investors may question whether its valuation is justified. On the other hand, a protocol with strong revenue generation relative to its market value may be viewed as undervalued.
These comparisons have become easier thanks to analytics dashboards. Platforms like DefiLlama and Token Terminal aggregate on-chain financial data and present it in standardized formats. This allows analysts to compare different blockchains, decentralized exchanges, lending platforms, and other protocols using consistent metrics.
For example, an investor analyzing a decentralized exchange might examine:
- total trading fees generated by the protocol
- the percentage retained as protocol revenue
- how much revenue flows to liquidity providers
- whether token holders receive any share of that value
By studying these factors together, investors can build a much clearer understanding of how value flows through a blockchain ecosystem.
Conclusion
The blockchain industry has matured significantly over the past few years. As the ecosystem grows, simple metrics such as token price or total value locked are no longer enough to evaluate the health of a protocol. This is why crypto revenue metrics have become essential tools for understanding the economics of blockchain networks. Each metric captures a different layer of value creation.
Total fees measure overall economic activity. Protocol revenue reveals how much income the application retains. Supply-side revenue shows how users are incentivized to participate. Chain revenue reflects the earnings of the underlying infrastructure. Holder revenue measures how value flows to token owners. Earnings ultimately determine whether a protocol operates sustainably.
Together, these metrics provide a financial framework for analyzing decentralized systems. As analytics platforms continue to standardize these measurements, investors will increasingly treat blockchain networks like digital businesses with measurable revenue streams and economic fundamentals.
Understanding crypto revenue metrics therefore helps readers move beyond market hype and focus on what truly matters: the real economic activity powering the blockchain ecosystem.
TL;DR — Crypto Revenue Metrics
- Crypto revenue metrics measure the real economic activity of blockchain networks.
- Total fees represent the full amount users pay to interact with a protocol.
- Protocol revenue shows how much income the application actually retains.
- Chain revenue reflects earnings captured by the underlying blockchain.
- Supply-side revenue rewards participants like liquidity providers and lenders.
- Holder revenue represents value returned directly to token holders.
- Earnings measure true profitability after operational costs.
- Metrics are tracked by platforms such as DefiLlama and Token Terminal.
- Investors use these indicators to compare protocol valuations.
- They help distinguish real economic traction from narrative-driven hype.
In this article
Total Fees: The Top Line of Blockchain ActivityApp Revenue: What the Protocol Actually KeepsChain Revenue: How Blockchains Capture ValueSupply-Side Revenue: The Incentives That Power DeFiHolder Revenue: Value Accruing to Token OwnersEarnings: Measuring True ProfitabilityOther Specialized Revenue CategoriesHow Investors Use Crypto Revenue MetricsConclusion