What Is Circulating Supply in Crypto? Formula & Examples
Learn what circulating supply means in crypto, how it differs from total and max supply, how it affects market cap, token unlocks, and price.
Author: Chirag Sharma
In crypto numbers tell a story far deeper than the price of a token. One of the most important numbers is the circulating supply. Unlike traditional fiat money, which can be printed by central banks, crypto supply is defined by code and consensus. This makes circulating supply crypto a core metric for anyone trying to judge scarcity, value, and potential price movement.
At its simplest, it is the amount of cryptocurrency that is currently tradable, spendable, or holdable by the public. It excludes locked tokens, reserves, and coins that have been permanently burned. Think of it as the liquid cash of a blockchain economy, the part people actually use.
Why does it matter? Because circulating supply directly influences:
- Scarcity: Fewer coins in the market often means higher perceived value.
- Market Cap: Calculated as price × circulating supply.
- Investor Confidence: Clear data prevents hidden inflation or dilution surprises.
Bitcoin made this concept famous. When Satoshi Nakamoto capped Bitcoin at 21 million coins, he baked scarcity into its DNA. By 2025, around 19.9 million Bitcoin are already circulating, leaving little room for inflation. Other cryptos take different paths: Ethereum, for example, has no hard cap but uses burning and staking to manage supply growth.
For investors, understanding circulating supply crypto metrics is not just about technical definitions. It is about protecting themselves from hype, spotting dilution risks, and grasping how scarcity narratives drive valuation.
What is Circulating Supply in Cryptocurrency
Circulating supply in crypto refers to the number of tokens available in the market at a given moment. These tokens are liquid, meaning they can be traded, spent, or held by anyone.
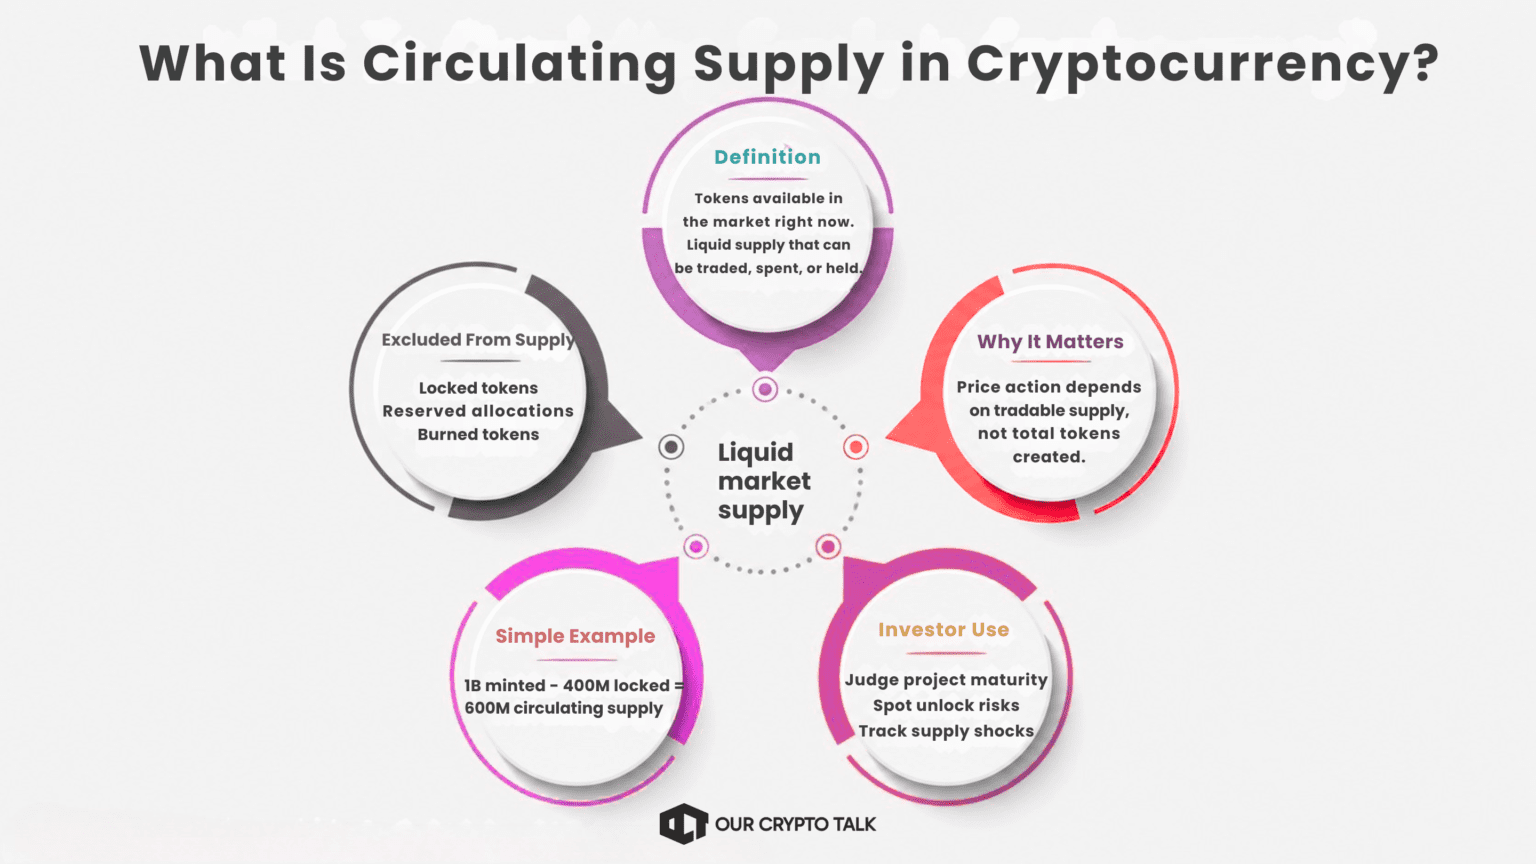
It excludes tokens that are:
- Locked: Held in smart contracts or vesting schedules.
- Reserved: Saved for project development or team allocation.
- Burned: Sent to inaccessible addresses, permanently removed from circulation.
Why this matters:
- A project may have minted 1 billion tokens, but if 400 million are locked for team incentives, the circulating supply is only 600 million.
- Price action is tied to what people can actually trade, not the total created.
Blockchain transparency makes circulating supply easier to verify than in traditional finance. Tools like Etherscan for Ethereum or Solana Explorer for Solana allow anyone to confirm supply figures. Data sites such as CoinMarketCap and CoinGecko aggregate this information, but savvy investors often double-check on-chain sources.
A useful analogy is to think of circulating supply as the money people carry in their wallets, while total supply includes reserves stored in a vault. The wallet money drives day-to-day transactions and market activity.
Investors use circulating supply to:
- Judge maturity: Older projects like Bitcoin have most of their supply circulating.
- Spot risks: Newer projects often have a small fraction circulating with big unlocks ahead.
- Track manipulation: Sudden supply increases from unlocked tokens can pressure prices.
In short, circulating supply is the liquid heartbeat of a crypto economy, and ignoring it leaves investors blind to how value is actually distributed.
Circulating Supply vs Total Supply vs Maximum Supply
The terms often get mixed up, but they are very different. To avoid confusion, let’s break them down:
- Circulating Supply -> Tokens currently available in the market for trading.
- Total Supply -> All tokens that exist so far, including those locked or reserved.
- Maximum Supply (Max Supply) -> The absolute cap of tokens that will ever exist.
Circulating Supply Is Like Public Float in Stocks. For readers coming from traditional markets, circulating supply is similar to public float in stocks.
Public float refers to the shares of a company that are available for public trading. It excludes shares held by insiders, promoters, governments, or other long-term restricted holders. Circulating supply works in a similar way for crypto. It focuses on the tokens that are actually available to the market, not every token that exists or may eventually exist.
For example, a crypto project may have 1 billion total tokens, but only 300 million tokens may be unlocked and tradable today. In that case, the circulating supply is closer to the token’s public float. The remaining tokens may sit in team wallets, treasury reserves, vesting contracts, staking contracts, or ecosystem funds.
This comparison helps investors understand why circulating supply matters. Just as public float affects a stock’s liquidity and valuation, circulating supply affects a crypto token’s market cap, scarcity, and potential dilution risk.
Examples from Top Cryptos
- Bitcoin (BTC)
- Circulating Supply: ~19.9 million
- Total Supply: ~19.9 million (but some lost forever due to lost keys)
- Maximum Supply: 21 million (hard cap, no more will ever be created)
- Effect: Built-in scarcity narrative, often compared to gold.
- Ethereum (ETH)
- Circulating Supply: ~120.7 million
- Total Supply: Roughly equal (since most ETH is tradable)
- Maximum Supply: None (no cap, but supply regulated with burns)
- Effect: Supply grows or shrinks based on network usage.
- Solana (SOL)
- Initial Mint: 500 million
- Circulating Supply (2025): ~540 million (inflation + rewards – burns)
- Maximum Supply: None fixed
- Effect: Unlocks and inflation add tokens, staking and burns balance growth.
| Cryptocurrency | Circulating Supply | Total Supply | Maximum Supply | Notes |
|---|---|---|---|---|
| Bitcoin (BTC) | ~19.9M | ~19.9M | 21M (capped) | Fixed scarcity; some BTC lost |
| Ethereum (ETH) | ~120.7M | ~120.7M | Unlimited | Supply balanced by burns & staking |
| Solana (SOL) | ~540M | ~540M | Unlimited | Inflation + unlocks, offset by burns |
Why These Differences Matter
- If circulating supply is low compared to total supply, future unlocks may flood the market.
- If circulating supply is close to max supply, scarcity is stronger and dilution risks are limited.
- Projects with no max supply (like ETH) rely on mechanisms like burning to control inflation.
Quick Scenario
Imagine two tokens both priced at $10:
- Token A -> 10 million circulating, but 1 billion total supply.
- Token B -> 10 million circulating, with only 12 million max supply.
Even at the same price, Token B appears far scarcer. Investors may assign higher long-term value to it.
Key Takeaways for Investors
- Always compare circulating vs total vs max to see the bigger picture.
- Price alone is misleading, market cap (price × circulating supply) is what really counts.
- A “cheap” coin with a low price but huge supply may not be a bargain at all.
How is Circulating Supply Calculated?
Circulating supply sounds simple, but the calculation can get tricky. At its core, the formula looks like this:
Circulating Supply = Total Supply – (Locked Tokens + Reserved Tokens + Burned Tokens)
Let’s break that down:
- Total Supply: All tokens minted so far.
- Locked Tokens: Coins held in vesting schedules or smart contracts, not tradable yet.
- Reserved Tokens: Allocations for development, partnerships, or team incentives.
- Burned Tokens: Coins sent to “dead” addresses and permanently removed.
Methods of Calculation
- On-chain verification
- Block explorers like Etherscan or Solana Explorer show exactly how many tokens exist.
- Lost coins (e.g., Bitcoin wallets with forgotten keys) complicate the picture, since they still count technically but are unusable.
- Self-reporting by projects
- Many projects submit supply data to aggregators such as CoinMarketCap or CoinGecko.
- These figures are usually cross-verified, but errors or intentional manipulation can occur.
- Audited data
- Research firms like Messari provide vetted supply metrics, often using analytics dashboards like Dune to track supply changes in real time.
Case Examples
- Bitcoin: Supply is simply the number of mined coins from blocks, minus unclaimed or lost BTC. Estimates suggest 3–4 million BTC are lost, meaning the effective circulating supply is lower than the reported 19.9 million.
- Ethereum: Post-Merge, staked ETH is still considered circulating because it can be withdrawn and traded. Burned ETH from EIP-1559, however, reduces net supply.
- Solana: As of 2025, circulating supply (~540M) comes from its initial mint (500M), minus burns, plus inflation rewards and unlocks.
Investor Tips
- Always confirm figures on explorers rather than relying only on aggregator sites.
- Watch out for projects that inflate “circulating supply” numbers by counting tokens that are technically locked.
| Project | Total Supply | Locked/Reserved | Burned | Circulating Supply |
|---|---|---|---|---|
| Bitcoin | 21M | 0 | 0 | ~19.9M (minus lost BTC) |
| Ethereum | ~120.7M | Minimal | 4M+ ETH burned | ~120.7M |
| Solana | 560M+ (incl. inflation) | Team allocations vested | Fee burns | ~540M |
The Importance of Circulating Supply in Crypto Valuation
Why does circulating supply matter so much? Because it directly ties into how we measure value.
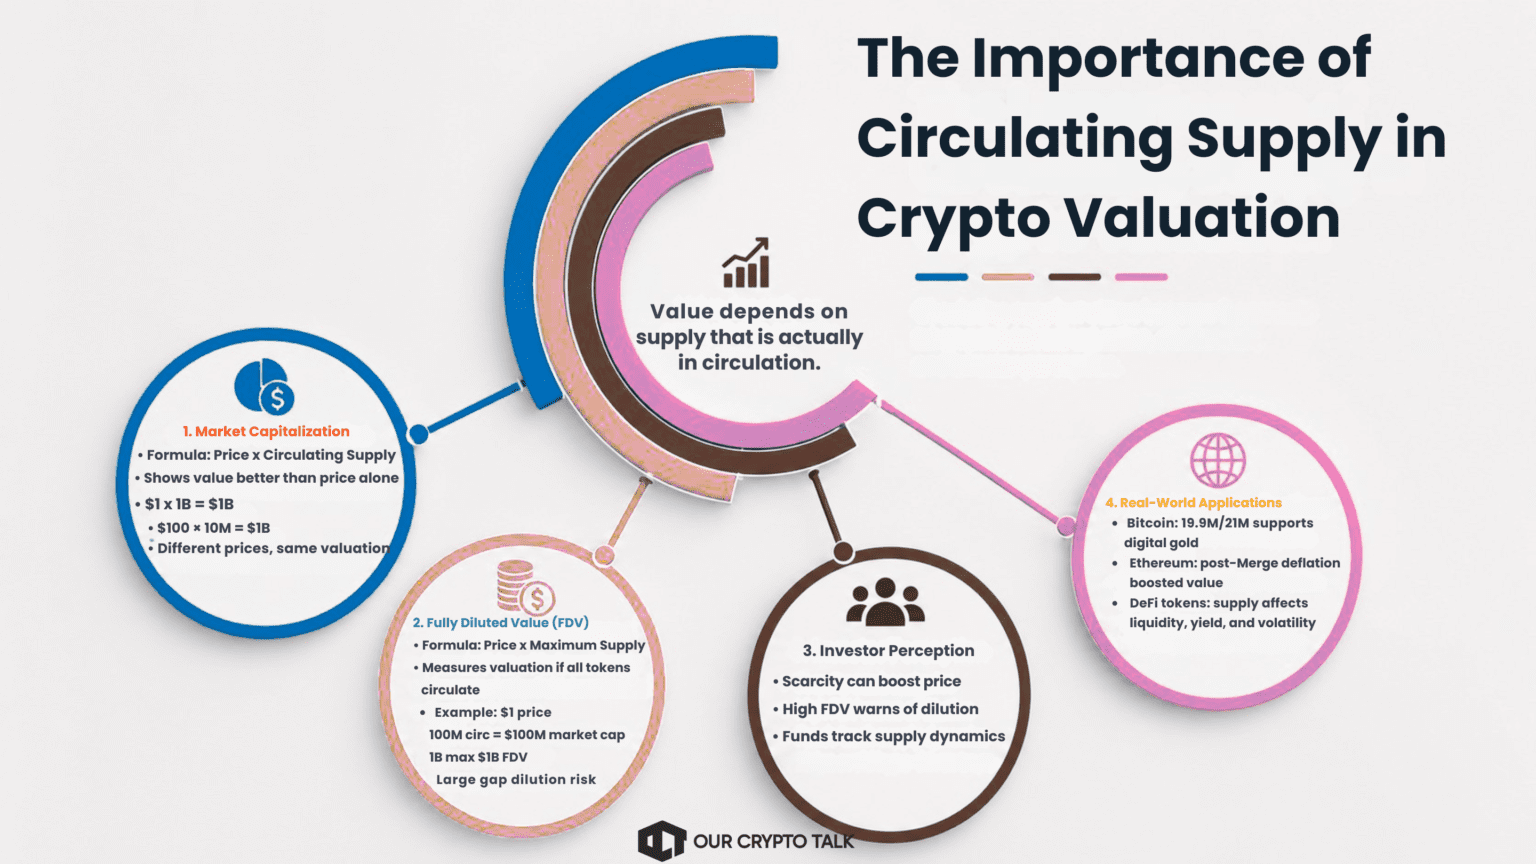
Market Capitalization
- Formula: Market Cap = Price × Circulating Supply
- This metric gives a clearer picture than price alone.
Example:
- Token A -> Price $1, Circulating Supply 1B -> Market Cap $1B
- Token B -> Price $100, Circulating Supply 10M -> Market Cap $1B
Even though one trades at $1 and the other at $100, they are valued equally in terms of market cap.
Fully Diluted Value (FDV)
- Formula: FDV = Price × Maximum Supply
- Shows potential valuation if all tokens eventually enter circulation.
- Helps assess future dilution risk.
Example:
- A project priced at $1 with 100M circulating but 1B max supply has a $100M market cap but a $1B FDV.
- This gap signals heavy future unlocks.
Why It Shapes Investor Perception
- Scarcity effect: Lower circulating supply with strong demand can push prices up.
- Risk assessment: High FDV relative to market cap warns of dilution.
- Institutional analysis: Funds track supply dynamics to avoid hype-driven traps.
Real-World Applications
- Bitcoin: Circulating supply nearing max (19.9M/21M) underpins its “digital gold” narrative and supports a $2T+ market cap.
- Ethereum: Deflationary supply during high activity boosted value post-Merge.
- DeFi tokens: Circulating supply impacts liquidity pools, yield farming returns, and volatility.
Key Takeaways
- Price alone misleads, market cap and FDV matter more.
- Always compare circulating supply against max supply to gauge scarcity.
- A coin with “only 1 cent” price may actually be overvalued if supply is massive.
Factors Influencing Circulating Supply in Crypto
Circulating supply is not fixed, it changes over time. Multiple factors dynamically shape it, making it essential to monitor regularly.
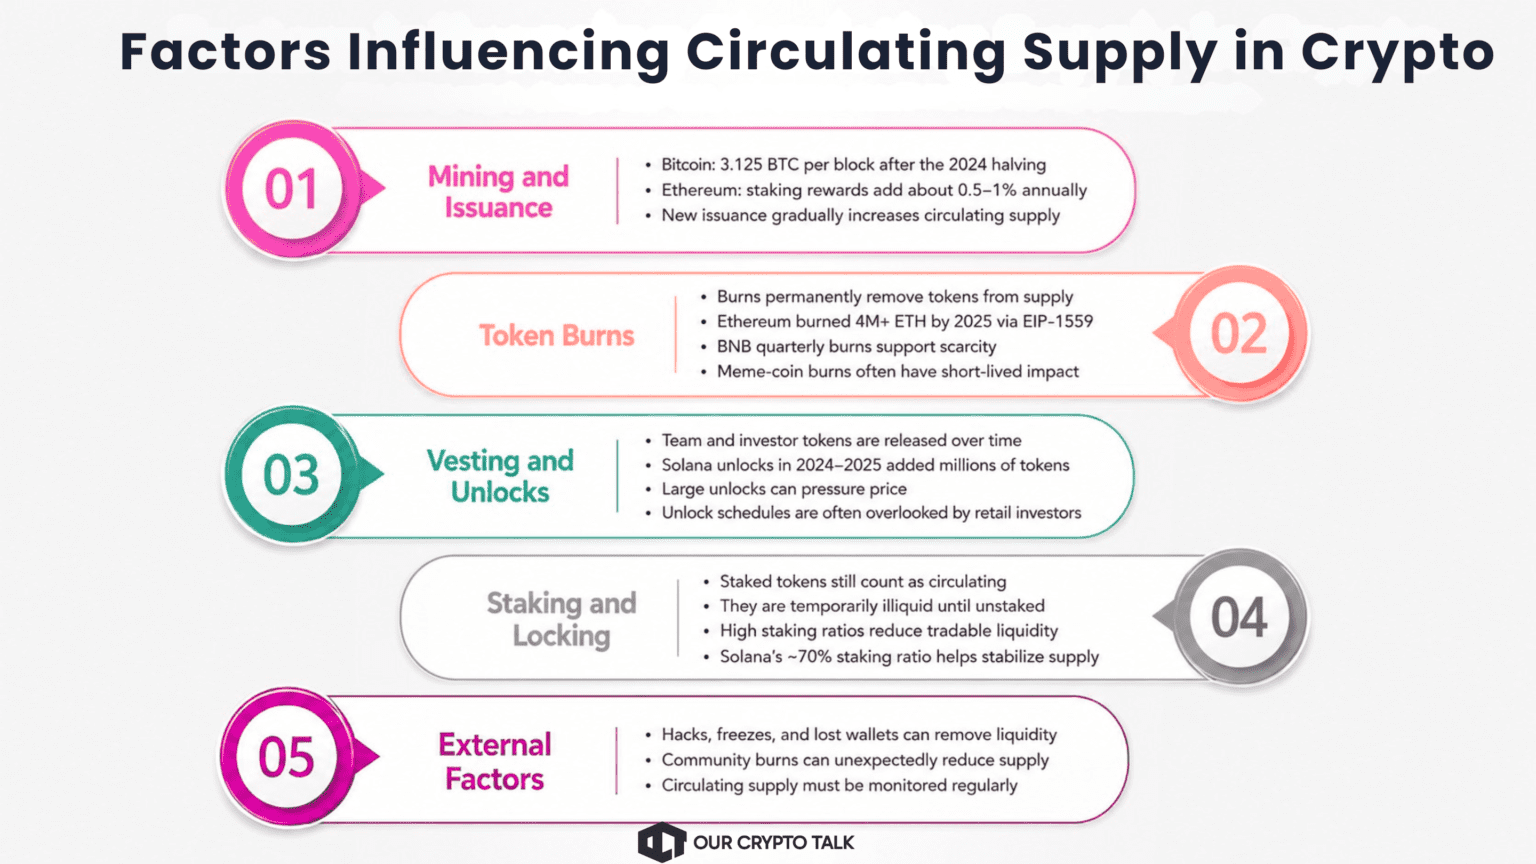
1. Mining and Issuance
- Bitcoin: New BTC enters circulation through block rewards, halved every four years. After the 2024 halving, rewards are 3.125 BTC per block, slowing supply growth.
- Ethereum: Post-Merge, new ETH enters circulation through staking rewards, adding about 0.5–1% annually.
2. Token Burns
- Permanently remove tokens from supply.
- Ethereum (EIP-1559): Burned over 4M ETH by 2025, worth billions, making ETH deflationary during high activity.
- BNB: Binance’s quarterly burns reduced billions of tokens, supporting scarcity.
- Meme coins: Dogecoin or Shiba Inu communities burn tokens for hype, though effects are often short-lived.
3. Vesting and Unlocks
- Founders and early investors usually have tokens released gradually.
- Solana: Unlocks in 2024–2025 added millions of tokens to circulation, sometimes pressuring price.
- Unlock schedules are published but often overlooked by retail investors.
4. Staking and Locking
- Staked tokens are considered circulating since they can be traded once unstaked, but they are temporarily illiquid.
- High staking ratios (like Solana’s ~70%) effectively reduce tradable liquidity, stabilizing supply.
5. External Factors
- Hacks, regulatory freezes, or lost wallets can suddenly lock tokens out of circulation.
- Community-driven burns can also remove supply in unexpected ways.
Why Monitoring Matters
- Supply increases (via unlocks or inflation) often put downward pressure on prices if demand doesn’t keep up.
- Burns or halving events, on the other hand, can create scarcity-driven rallies.
- Staking reduces liquid supply, often leading to price stabilization in volatile markets.
Quick Checklist for Investors
- Track halvings and issuance models for PoW coins.
- Review vesting schedules for new tokens.
- Monitor burn mechanisms and whether they’re consistent or one-time.
- Assess staking participation to understand liquid vs illiquid supply.
| Factor | Example (2025) | Effect on Supply |
|---|---|---|
| Mining/Issuance | BTC halving to 3.125 BTC/block | Slows growth |
| Burns | ETH EIP-1559 burned 4M+ ETH | Reduces supply |
| Vesting/Unlocks | Solana token releases 2024–25 | Increases supply |
| Staking | ~70% of SOL staked | Reduces liquid tokens |
| External Events | Ripple escrow releases, hacks | Mixed impact |
Real-World Examples and Case Studies
Theory becomes much clearer with real-world data. Different cryptos manage supply in unique ways, shaping price and investor perception.
1. Bitcoin (BTC) – The Scarcity Standard
- Circulating Supply (2025): ~19.9M out of 21M max.
- Mechanism: New BTC enters through block rewards, halved every 4 years. After the 2024 halving, block rewards dropped to 3.125 BTC.
- Impact: Scarcity narrative strengthens as issuance slows, supporting a price above $113,000 and a $2T+ market cap.
Takeaway: Bitcoin proves how a fixed cap and predictable issuance build trust and long-term value.
2. Ethereum (ETH) – Dynamic Supply Management
- Circulating Supply (2025): ~120.7M, no maximum supply cap.
- Mechanism: EIP-1559 burns transaction fees, offsetting staking rewards. Over 4M ETH burned since 2021, worth over $10B.
- Impact: During network activity spikes, ETH becomes deflationary, boosting its “ultrasound money” narrative.
Takeaway: Ethereum shows how a flexible supply model can still deliver scarcity effects through utility and burns.
3. Solana (SOL) – Balancing Inflation and Adoption
- Circulating Supply (2025): ~540M SOL.
- Mechanism: Started with 500M tokens, later inflation (~4.3% yearly) and unlocks expanded supply. Fee burns offset some issuance.
- Impact: High staking participation (~70%) and strong DeFi adoption pushed prices over $180 despite unlock pressure.
Takeaway: Even with inflation, adoption and staking can maintain scarcity dynamics.
4. Ripple (XRP) – Legal Wins and Controlled Releases
- Circulating Supply (2025): ~54B XRP out of 100B max.
- Mechanism: Ripple releases tokens gradually from escrow. Network burns small amounts in transaction fees.
- Impact: 2025 legal clarity plus reduced circulating supply helped push XRP near $2.89.
Takeaway: Transparent release schedules and ecosystem milestones can stabilize a large-supply token.
5. Meme Coins – Community Burns and Hype
- Shiba Inu: Trillions burned by community initiatives, creating temporary rallies.
- Dogecoin: Uses inflationary issuance, but burns and hype occasionally affect supply-demand balance.
Takeaway: Burns without utility may cause short-term price spikes but rarely sustain long-term value.
Can This Coin Reach $1? A Market Cap Example
One of the most common questions in crypto is whether a low-priced coin can reach $1. The answer depends less on the current token price and more on the market cap that price would require.
The formula is simple:
Required Market Cap = Target Price × Circulating Supply
For example, if a token has 100 billion tokens in circulating supply, reaching $1 would require:
$1 × 100 billion tokens = $100 billion market cap
That means the project would need to be valued at $100 billion for the token to trade at $1, assuming the circulating supply stays the same. If more tokens unlock later, the required market cap would rise even further.
This is why investors should not ask only, “Can this coin reach $1?” A better question is:
“What market cap would this price require, and is that valuation realistic compared with similar crypto projects?”
Risks and Misconceptions Around Circulating Supply
Many investors understand token price before they understand token supply. That often leads to poor comparisons, inflated expectations, and missed dilution risks. Here are the biggest mistakes to avoid.
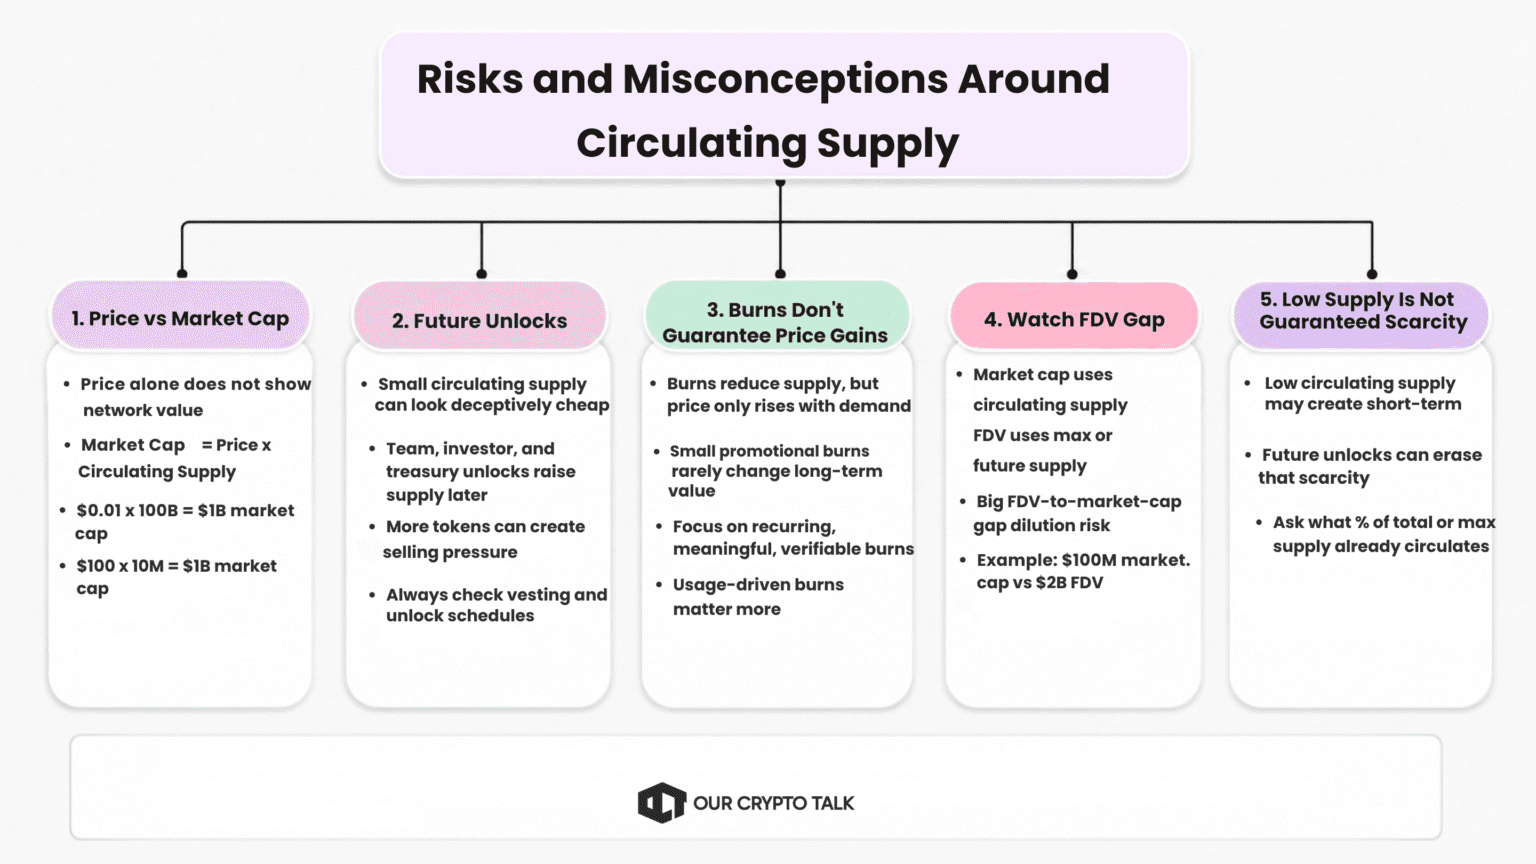
1. Comparing Coin Prices Instead of Market Caps
A token priced at $0.01 is not automatically cheaper than a token priced at $100. Price only tells you the cost of one unit. It does not show the full value of the network.
The better metric is:
Market Cap = Token Price × Circulating Supply
For example, a coin trading at $0.01 with 100 billion tokens circulating already has a $1 billion market cap. A coin trading at $100 with 10 million tokens circulating also has a $1 billion market cap. Different prices, same market value.
2. Ignoring Future Token Unlocks
A project may look fairly valued today because only a small portion of tokens trade in the market. But if large team, investor, or treasury allocations unlock later, circulating supply can rise quickly.
This matters because more supply entering the market can create selling pressure if demand does not grow at the same pace. Always check vesting schedules, token unlock calendars, and team allocations before buying.
3. Assuming Token Burns Always Raise Price
Burns reduce supply, but they do not automatically increase price. A burn only matters if it is large enough, verifiable, and paired with real demand.
Small promotional burns may create short-term attention, but they rarely change long-term valuation. Investors should ask whether burns are recurring, meaningful relative to total supply, and tied to actual network usage.
4. Overlooking the FDV-to-Market-Cap Ratio
The gap between market cap and fully diluted valuation can reveal major dilution risk.
Market cap uses circulating supply.
FDV uses max supply or total future supply.
If a token has a $100 million market cap but a $2 billion FDV, most of its supply has not entered circulation yet. That does not always mean the token is bad, but it tells investors that future unlocks could heavily dilute current holders.
5. Treating Low Circulating Supply as Guaranteed Scarcity
Low circulating supply can create scarcity, but only in the short term. If most tokens are locked and scheduled to unlock later, scarcity may disappear over time.
A better question is: What percentage of total or max supply is already circulating? A token with only 10% circulating supply may face much higher dilution risk than a token with 80% circulating supply.
6. Trusting One Supply Source Without Verifying
CoinMarketCap, CoinGecko, explorers, and project dashboards may show slightly different numbers. These differences can happen because of locked wallets, bridge contracts, staking contracts, vested but unclaimed tokens, burned tokens, and self-reported project data.
- Circulating Supply In Crypto = tokens actively tradable in the market.
- Different from Total Supply (all minted) and Max Supply (absolute cap).
- Calculation: Total supply – (locked + reserved + burned).
- Matters because it defines market cap and shapes scarcity.
- Key influences: mining/issuance, burns, unlocks, staking, external shocks.
- Examples:
- Risks: Misreporting, hype around “low supply,” ignoring FDV.
- Smart investors pair supply metrics with fundamentals and demand.
Pre-Buy Checklist
At-a-glance comparison of crypto supply metrics
- What percentage of max supply is circulating?
- What is the current market cap?
- What is the fully diluted valuation?
- Are major unlocks coming?
- Who holds locked or reserved tokens?
- Are burns real, recurring, and meaningful?
- Is demand growing faster than supply?
- Do CoinMarketCap, CoinGecko, and explorers broadly agree?
Conclusion
Circulating supply has become one of the most important metrics in crypto. It acts as a window into scarcity, market cap, and long-term sustainability. But it’s only powerful when understood in context. A token’s price means little without knowing how many coins are truly circulating, how many are locked, and what future unlocks look like.
Bitcoin’s hard cap shows how scarcity can drive adoption. Ethereum’s dynamic burns prove that flexible supply can still sustain value. Solana’s growth highlights how staking and adoption balance inflation. Across all examples, one truth stands out: supply models shape narratives, and narratives shape markets.
Looking ahead, as tokenomics evolve for new categories like AI-powered coins or DePIN projects, circulating supply will remain a critical reference point. Investors who dig beyond surface-level price action and study supply metrics will be better positioned to separate hype from value.
Circulating supply crypto analysis is not about memorizing formulas. It is about asking the right questions: How many tokens are liquid today? How many more could enter the market? And does demand match the supply story? Those who master these questions will navigate the volatility of crypto with far more confidence.
This article is for informational purposes only and does not constitute financial advice.
Frequently Asked Questions
What is circulating supply in cryptocurrency?
Why does circulating supply matter?
How is circulating supply different from total and maximum supply?
How is circulating supply calculated?
What factors influence circulating supply over time?
Why is circulating supply important for investors?
What are the risks or misconceptions around circulating supply?
In this article
What is Circulating Supply in CryptocurrencyCirculating Supply vs Total Supply vs Maximum SupplyThe Importance of Circulating Supply in Crypto ValuationFactors Influencing Circulating Supply in CryptoCan This Coin Reach $1? A Market Cap ExampleRisks and Misconceptions Around Circulating SupplyPre-Buy ChecklistConclusion