7 Best Metrics For Crypto Market Sentiment Analysis
Learn how crypto market sentiment drives price trends. Explore 7 top metrics to track mood, news impact, and social media buzz in real time.
Author: Chirag Sharma
In crypto, prices rarely move in isolation. They’re shaped by a complex mix of investor emotions, social media buzz, macroeconomic signals, and project-specific news. This is where crypto market sentiment comes into play—a powerful force that can amplify trends, fuel hype cycles, or trigger panic sell-offs.
Sentiment refers to the overall attitude of market participants toward a particular asset or the broader crypto space. It ranges from extreme greed to deep fear, often moving faster than technical indicators or fundamental developments. For crypto traders and investors, understanding market sentiment isn’t optional—it’s essential.
Whether you’re a short-term scalper or a long-term HODLer, recognizing sentiment shifts helps you:
- Enter or exit positions with greater confidence.
- Spot early warning signs of market reversals.
- Filter noise from meaningful signals.
As crypto markets operate 24/7, the emotional rollercoaster never stops. Learning how to interpret sentiment can offer a significant edge in navigating volatility.
Understanding Crypto Market Sentiment
Crypto market sentiment is the collective emotion and perception of market participants at a given time. It reflects whether traders feel bullish (optimistic), bearish (pessimistic), or neutral about the future price direction of assets like Bitcoin, Ethereum, or altcoins.

How It Differs from Traditional Market Sentiment
While sentiment exists in all financial markets, the crypto landscape is uniquely reactive:
- There are no closing bells—news spreads instantly, and sentiment shifts within minutes.
- Retail investors dominate the space, making it highly emotional and momentum-driven.
- Sentiment isn’t just shaped by charts and earnings but by memes, tweets, influencers, and token launches.
In traditional markets, analysts rely heavily on earnings reports, GDP data, and central bank decisions. In crypto, a single tweet from a notable figure or a trending token can move billions.
Why Sentiment Matters in Crypto
Unlike stocks or commodities, most cryptocurrencies lack intrinsic valuation models. Their value is often driven by community belief, hype, and perceived utility, which makes sentiment a primary force.
Here’s why sentiment is critical:
- Predicts price action before it happens: Sharp shifts in sentiment often lead to trend reversals.
- Reveals herd behavior: When everyone is euphoric, risk increases; when fear is extreme, opportunities arise.
- Supports strategy timing: Combining sentiment analysis with technical levels can fine-tune entry and exit points.
In short, sentiment is the invisible hand guiding price movements, especially in markets known for volatility and speculation.
Key Factors Influencing Crypto Market Sentiment
Several overlapping variables shape how investors feel about the crypto market. These elements often interact, compounding their effects. Understanding them can help decode mood shifts early.
1. News and Headlines
Breaking news has a powerful influence on sentiment—both positive and negative.
Examples:
- Regulatory crackdowns in major markets (e.g., SEC lawsuits) often trigger fear.
- Bitcoin ETF approvals or favorable legislation tend to boost optimism.
- Major exchange hacks or project exploits cause immediate panic and sell-offs.
News travels fast on platforms like X (formerly Twitter), Reddit, and Telegram. The speed and virality of information make crypto sentiment highly reactive.
2. Social Media and Influencers
Crypto thrives on social energy. Posts from major influencers, founders, or even anonymous accounts can shift sentiment instantly.

Key Platforms:
- Twitter/X: Home to traders, analysts, and project leaders.
- Reddit: Subreddits like r/CryptoCurrency and r/Bitcoin serve as sentiment barometers.
- YouTube & TikTok: Visual platforms drive community narratives, especially among retail investors.
Sentiment tools like LunarCrush specialize in tracking social mentions, engagement levels, and trending narratives to quantify emotional momentum.
3. Price Action and Volatility
Market structure directly affects how investors feel. Steep uptrends can trigger FOMO (fear of missing out), while sharp drops provoke FUD (fear, uncertainty, doubt).
Common patterns:
- Parabolic rallies often signal peak optimism—and potential reversals.
- Flash crashes create short-term panic and oversold sentiment.
- Sideways ranges usually lead to indecision or declining interest.
Volatility fuels emotion. This is why sentiment indicators often spike during wild price swings.
4. On-chain Metrics
Blockchain data provides insight into investor behavior, which directly influences sentiment.
Key on-chain signals:
- Whale movements: Large wallets transferring tokens to exchanges may trigger fear.
- Network activity: A rise in active addresses or transaction volume can boost confidence.
- Supply trends: Dormant coins moving or long-term holders selling often reflects changing sentiment.
Tools like Glassnode and CryptoQuant offer dashboards to track these patterns in real time. Learn more about onChain metrics here
5. Macroeconomic and Global Events
Although crypto is often described as “decentralized” or “uncorrelated,” it doesn’t exist in a vacuum.
Macro drivers:
- Inflation data and interest rate hikes affect risk appetite across all markets.
- Geopolitical tensions (e.g., wars or sanctions) can shift attention to or away from crypto.
- Dollar strength or weakness can influence Bitcoin’s role as an alternative asset.
In bear markets, macro factors usually weigh more heavily on sentiment than in euphoric altseasons.
6. Project Developments and Rug Pulls
Project-specific sentiment matters too. When a blockchain announces an upgrade or hits a key milestone, excitement often follows.
Examples:
- Ethereum’s shift to proof-of-stake (The Merge) brought massive attention and speculation.
- Airdrops and token launches increase community involvement and bullish sentiment.
- Delays, bugs, or rug pulls quickly reverse positive emotion. Mantra’s single day liquidation of over $4B causes the entire market to slow down.

Traders often track developer activity, GitHub commits, or roadmap progress to gauge sentiment around specific projects.
Sentiment Indicators and Top 7 Metrics
Understanding market sentiment is critical in crypto. It helps traders stay ahead of emotional waves that often lead to irrational decisions. Sentiment indicators aggregate data from multiple sources—such as price, volume, social media, and on-chain behavior—to reflect how market participants feel.
These indicators don’t predict the future, but they can signal extremes. That’s where the edge lies.
1. Fear and Greed Index
This indicator compresses various market data points into a score from 0 (extreme fear) to 100 (extreme greed).
What it tracks:
- Volatility and momentum
- Social sentiment
- Dominance shifts
- Google Trends
How to use it:
- Extreme fear often aligns with market bottoms.
- Extreme greed frequently precedes corrections.

Smart traders watch for these emotional extremes and prepare accordingly.
2. Funding Rates
Funding rates reflect trader sentiment in perpetual futures markets. They adjust periodically to keep prices in line with spot markets.
Insights provided:
- Positive funding: Longs dominate, bullish sentiment prevails.
- Negative funding: Shorts are aggressive, bearish tone in the market.
Extended high funding suggests euphoria. Markets tend to shake out overleveraged positions.
3. Social Volume and Mentions
This metric tracks how often a project or token is mentioned on platforms like X (Twitter), Telegram, and Reddit.
What to monitor:
- Sharp increases in chatter
- Tone of discussion (bullish or skeptical)
- Organic vs. artificial hype
Tools like LunarCrush and Santiment analyze this data to map crowd behavior. When social buzz rises faster than price, expect volatility.
4. On-Chain Metrics
On-chain data reflects what wallets are actually doing—not just what traders are saying.
Key indicators:
- Exchange inflows: Rising inflows hint at selling pressure.
- Exchange outflows: Often mean holders are accumulating.
- Whale activity: Tracking large wallets can show high-conviction behavior.
Glassnode, Nansen, and CryptoQuant offer tools to interpret these signals in real time.
5. Open Interest and Liquidations
Open interest shows the total value of open derivative positions. When paired with liquidation data, it provides clues about market stress or leverage imbalances.
Useful patterns:
- Rising open interest + low volatility: Leverage building up
- Sudden liquidations: Market shakeouts or trend reversals
Watch for liquidation cascades, especially during times of high leverage.
6. Google Trends
Google Trends tracks search volume for terms like “Bitcoin,” “crypto bull run,” or specific token names.
Use cases:
- Spike in searches often marks retail re-entry.
- Decline in interest may show fading hype.
It’s a lagging metric but works well when paired with social and price data.
7. Weighted Sentiment Scores
Some analytics platforms generate a weighted sentiment score by combining several data sources into a single view.
Sources include:
- Social media engagement
- Developer activity
- Exchange volumes
- News sentiment
These scores offer a quick overview of overall mood and can help filter noise. Santiment and Messari offer versions of this, often labeled as “weighted social sentiment” or “aggregate sentiment.”
Blockchain Metrics and Market Health Indicators
Blockchain metrics offer a ground-level view of how healthy a network is. Unlike speculative sentiment, these metrics reflect real, verifiable activity. For long-term investors and active traders, tracking on-chain metrics can reveal growing momentum or subtle weakness in fundamentals.
Daily Active Addresses (DAA)
Daily active addresses show how many wallets are interacting with the blockchain in a given day.
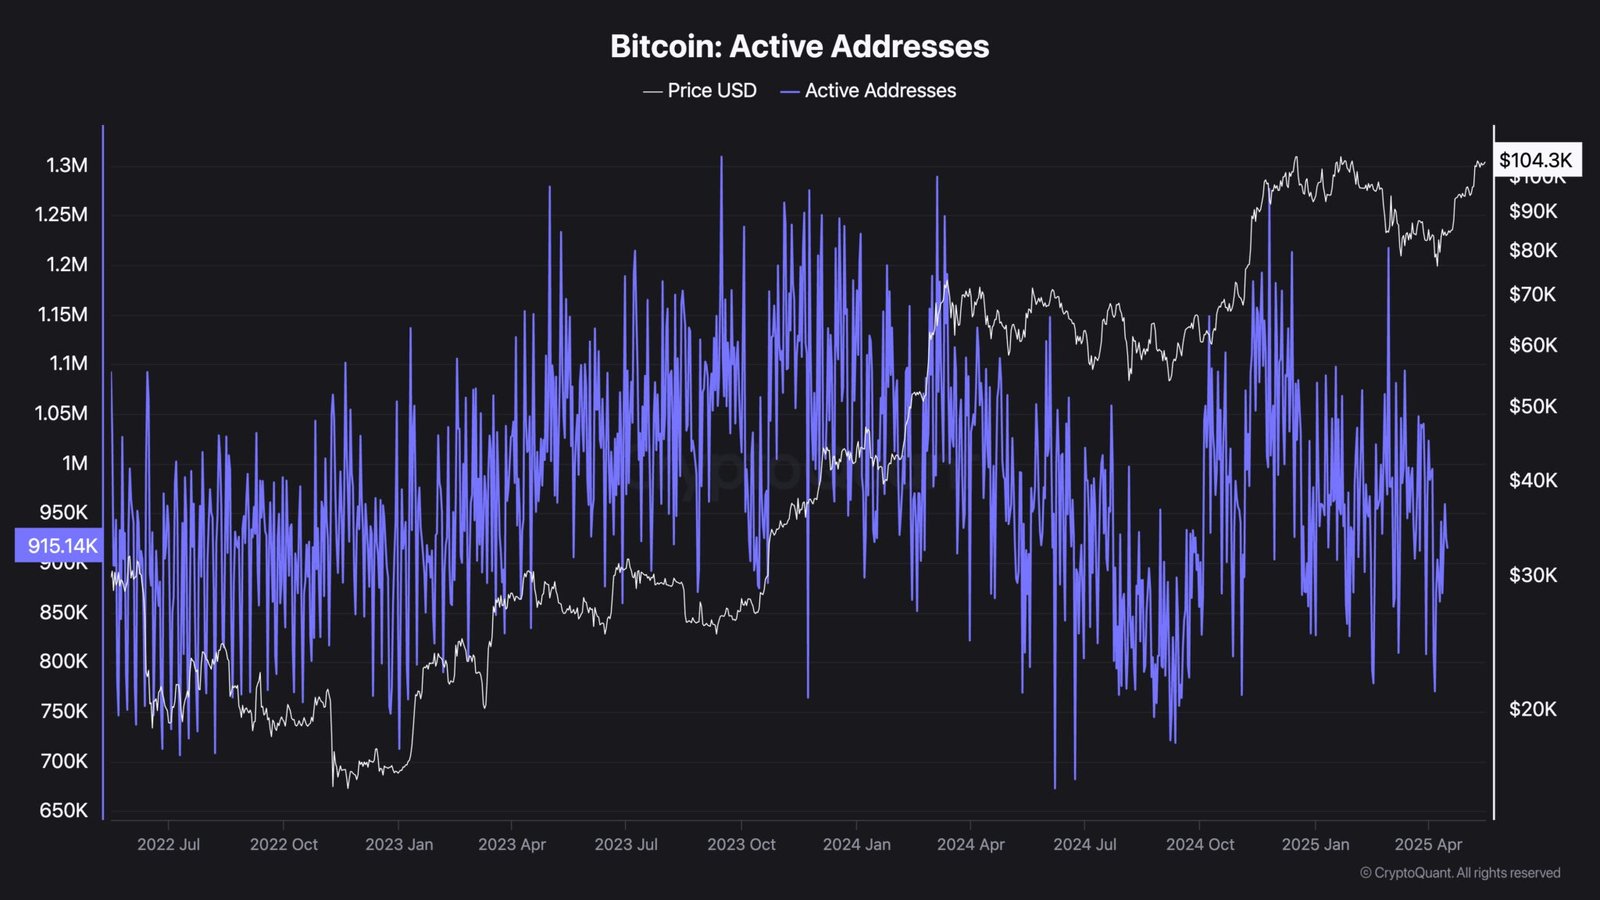
Why it matters:
- Growth in DAA often signals increased adoption.
- A sudden drop can reflect cooling demand or fading interest.
Projects with steady or rising address activity often maintain stronger price support during downturns. Tools like Santiment and Glassnode make it easy to monitor DAA trends over time.
Network Value to Transactions Ratio (NVT)
NVT compares a network’s market cap to the value transacted on-chain. It works like a price-to-earnings ratio in stocks.
Key insights:
- High NVT: The asset may be overvalued relative to usage.
- Low NVT: Indicates healthy usage or undervaluation.
It’s a simple yet effective filter for evaluating long-term potential and identifying overhyped assets.
Transaction Volume and Fee Metrics
The total transaction volume gives a rough idea of network demand. High volume shows active use. But volume alone isn’t always reliable—spam can inflate it.
Transaction fees add another layer.
When fees matter:
- Rising fees suggest congestion and demand.
- Declining fees can point to a quiet or underused chain.
Metrics like average fees, gas prices, and total fees burned (especially on Ethereum) help gauge network pressure and validate growth narratives.
Hashrate and Security Metrics
For proof-of-work blockchains like Bitcoin, hashrate is a crucial health signal.
Why monitor hashrate:
- Higher hashrate = more miners securing the network.
- Sudden drops may suggest miner capitulation or operational issues.
Other security-related indicators include Nakamoto Coefficient, validator count (for proof-of-stake), and decentralization ratios.
Healthy networks attract capital. Tracking these metrics gives traders an early heads-up when foundational cracks start to form.
Tokenomics and Supply Analytics
Tokenomics refers to how a token’s supply and incentives are structured. Traders who ignore supply dynamics risk missing the bigger picture. While price might pump, looming unlocks or inflation can pull it back down just as fast.
Here’s how to read between the lines.
Circulating vs. Total Supply
Understanding the circulating supply helps gauge how much of a token is actively trading.
Key considerations:
- A low circulating supply with high total supply can mean dilution risk.
- A high circulating ratio signals that most of the supply is already in the market.
Websites like CoinGecko and Messari clearly show these stats, including unlock schedules and historical emission rates.
Vesting Schedules and Token Unlocks
Projects often lock up large portions of tokens for team members, investors, or ecosystem growth. When these unlock, they can trigger price drops.
What to watch:
- Cliff unlocks (large one-time events)
- Gradual vesting vs. front-loaded releases
- Distribution concentration among insiders
Platforms like TokenUnlocks or CryptoRank help visualize upcoming unlock events across projects.
Inflation and Emission Rates
Some tokens have ongoing inflation baked into the protocol. This is common in staking ecosystems.
Impact on traders:
- High emissions = downward pressure unless demand outpaces supply.
- Flat or deflationary supply helps tokens retain value.
Compare emissions with staking yields. If yields are high but inflation exceeds it, holders still lose out over time.
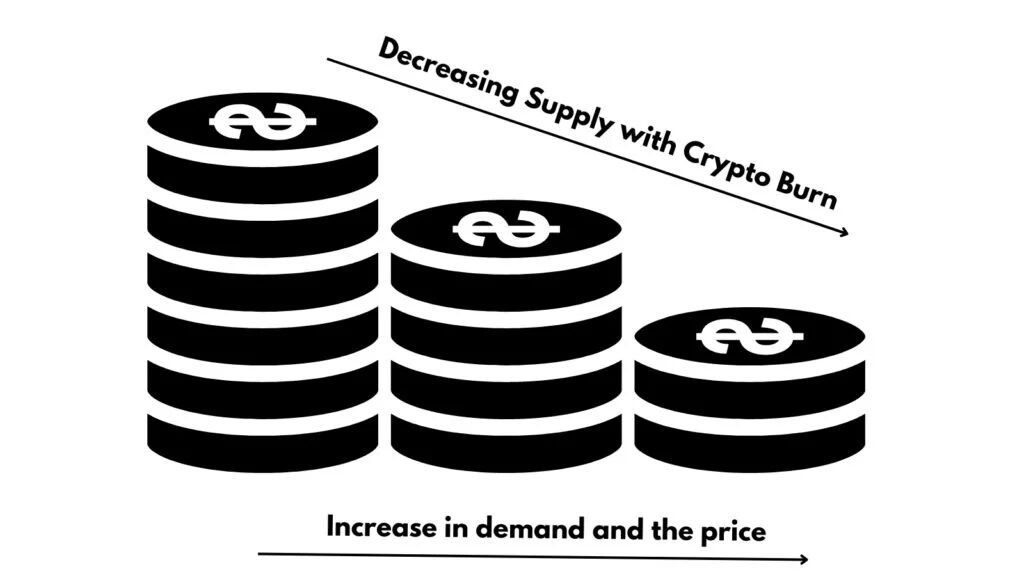
Token Utility and Burn Mechanisms
A token’s function within its ecosystem matters. Utility tokens gain strength when they’re required for actual use cases, like paying fees or accessing features.
Burn mechanisms add value when:
- Fees are automatically burned (e.g., Ethereum’s EIP-1559).
- Buyback and burn programs are sustained and transparent.
A strong use case paired with active burn mechanics can shift supply-demand in favor of holders.
Tokenomics alone won’t guarantee performance, but it can reveal structural flaws or strengths that are invisible on a price chart.
Macro and Correlation Analytics
Crypto doesn’t move in isolation. Understanding its relationship with broader markets, macro indicators, and internal sector rotations can give you an extra edge.
Bitcoin Dominance and Altcoin Cycles
Bitcoin Dominance (BTC.D) measures how much of the total crypto market cap is held by Bitcoin. It’s a key signal for altcoin strength.
Typical cycles:
- Rising BTC.D: Capital rotates to Bitcoin; altcoins usually lag or bleed.
- Falling BTC.D: Altseason potential increases as funds shift to smaller caps.
Smart traders use BTC.D to time entries into altcoins or rotate back into Bitcoin for safety.
Correlation with Traditional Markets
Bitcoin often shows varying correlation with assets like the S&P 500, gold, or the dollar index (DXY). ETF flows also play an important role as seen since the launch
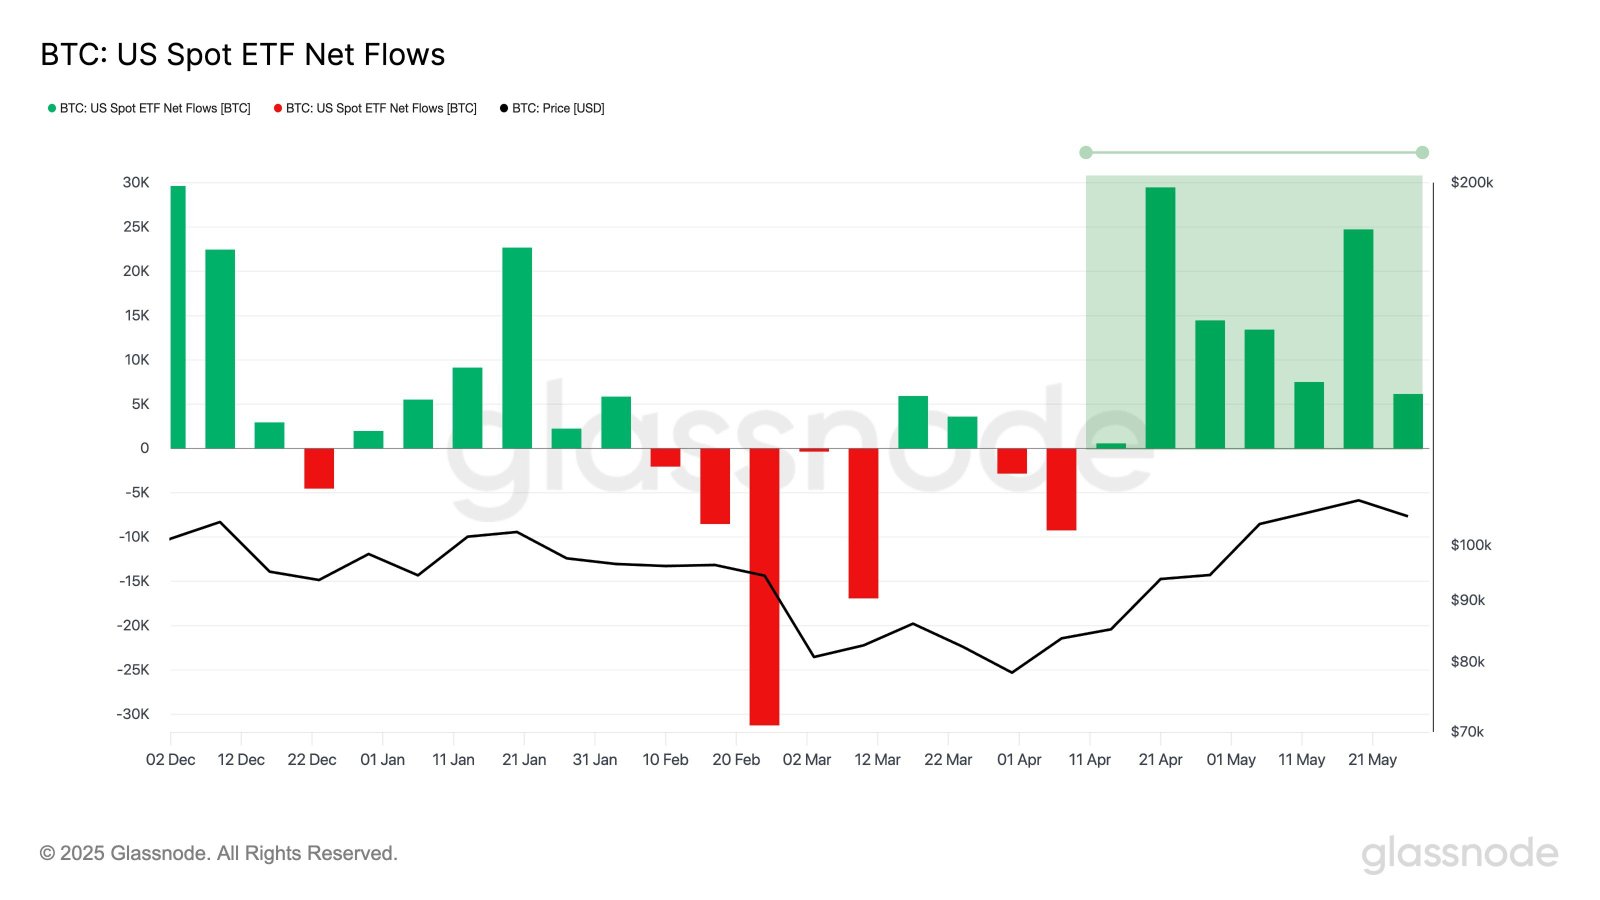
Use cases:
- Strong correlation with equities: Indicates risk-on sentiment.
- Rising DXY + falling crypto: Macro headwinds incoming.
- Divergence from traditional assets: Watch for decoupling.
Platforms like TradingView or MacroMicro chart these correlations clearly. It’s essential when trying to navigate Fed meetings, inflation prints, or global risk events.
Stablecoin Flows
Stablecoins act as dry powder in the crypto ecosystem. When they flow into exchanges, it often signals intent to buy. When they move off, the market might cool off.
Key insights:
- Exchange inflows = potential bullish pressure.
- Exchange outflows = sidelining capital or risk-off sentiment.
Monitor USDT, USDC, and DAI flows using tools like CryptoQuant or Coinglass.
Treasury Yields and Interest Rate Impact
Traditional finance indicators like the US 10-year yield or Fed Funds Rate can ripple into crypto.
Why it matters:
- Rising yields = higher opportunity cost to hold non-yielding assets like Bitcoin.
- Lower rates = more risk-on flows toward speculative markets.
While crypto is a separate asset class, it still responds to global liquidity changes. Macro awareness keeps traders grounded when narratives shift.
Conclusion
Crypto market sentiment analysis offers traders a strategic edge in understanding emotional shifts before price changes become obvious. By tracking how news, social media, and on-chain behaviors shape investor mood, market participants can gain early signals of bullish or bearish moves. The emotional volatility of the crypto space makes sentiment a powerful indicator, especially when combined with technical or on-chain data.
The tools covered—Santiment, LunarCrush, Botsfolio, Glassnode, CryptoCompare, Messari, and Alternative.me—offer a range of perspectives. Some emphasize social media tracking, others focus on blockchain metrics or integrated trading strategies. Each serves a different kind of trader, from short-term scalpers to long-term holders.
However, sentiment is not a silver bullet. It works best when used alongside broader research. Market noise, manipulation, and rapid changes can cloud the data. Still, by mastering the art of reading crowd behavior, crypto traders can stay ahead of trends, manage risks better, and make smarter moves in a fast-moving market.
TL;DR
- Crypto market sentiment reflects investor emotions like fear, greed, and optimism.
- Shifts in sentiment often precede price action in the volatile crypto space.
- Social media, news events, and macroeconomic signals are key drivers of sentiment.
- Santiment and LunarCrush help track real-time sentiment through social media data.
- Botsfolio blends sentiment analysis with automated trading for active strategy use.
- Glassnode and CryptoCompare provide on-chain and price sentiment metrics.
- Messari adds depth with sentiment scoring in its research tools.
- Alternative.me’s Fear and Greed Index offers a snapshot of overall market mood.
- Sentiment analysis is not always accurate and can be influenced by bots or manipulation.
- Combining sentiment with on-chain data and technical indicators improves results.
- Real-world cases like Dogecoin’s 2021 rally show the power of crowd emotion.
- Blockchain metrics like address activity and NVT ratio validate or challenge sentiment trends.
- Tokenomics affect how sentiment plays out—unlocks and emissions create supply pressure.
- Bitcoin dominance can signal whether altcoin sentiment is rising or falling.
- Data quality, real-time access, and context matter when interpreting sentiment.
- Future sentiment tools will rely more on AI and natural language processing.
- Traders should track both qualitative and quantitative indicators of market mood.
- Long-term investors benefit from understanding emotional cycles and investor psychology.
- Knowing when fear is overdone can present opportunities for value buying.
- Sentiment insights work best when paired with discipline and objective research.
- In crypto, understanding the crowd often means understanding the future.
Frequently Asked Questions
What is crypto market sentiment?
Why does sentiment matter more in crypto than in traditional markets?
What are the key factors that influence crypto sentiment?
Which indicators are used to measure market sentiment?
How do blockchain metrics tie into sentiment?
What role do tokenomics play in sentiment?
What macro factors impact crypto market mood?
Which tools can traders use for sentiment analysis?
What are the limitations of sentiment analysis?
How can traders use sentiment to their advantage?
In this article
Understanding Crypto Market SentimentKey Factors Influencing Crypto Market SentimentSentiment Indicators and Top 7 MetricsBlockchain Metrics and Market Health IndicatorsTokenomics and Supply AnalyticsMacro and Correlation AnalyticsConclusionTL;DRFrequently Asked Questions