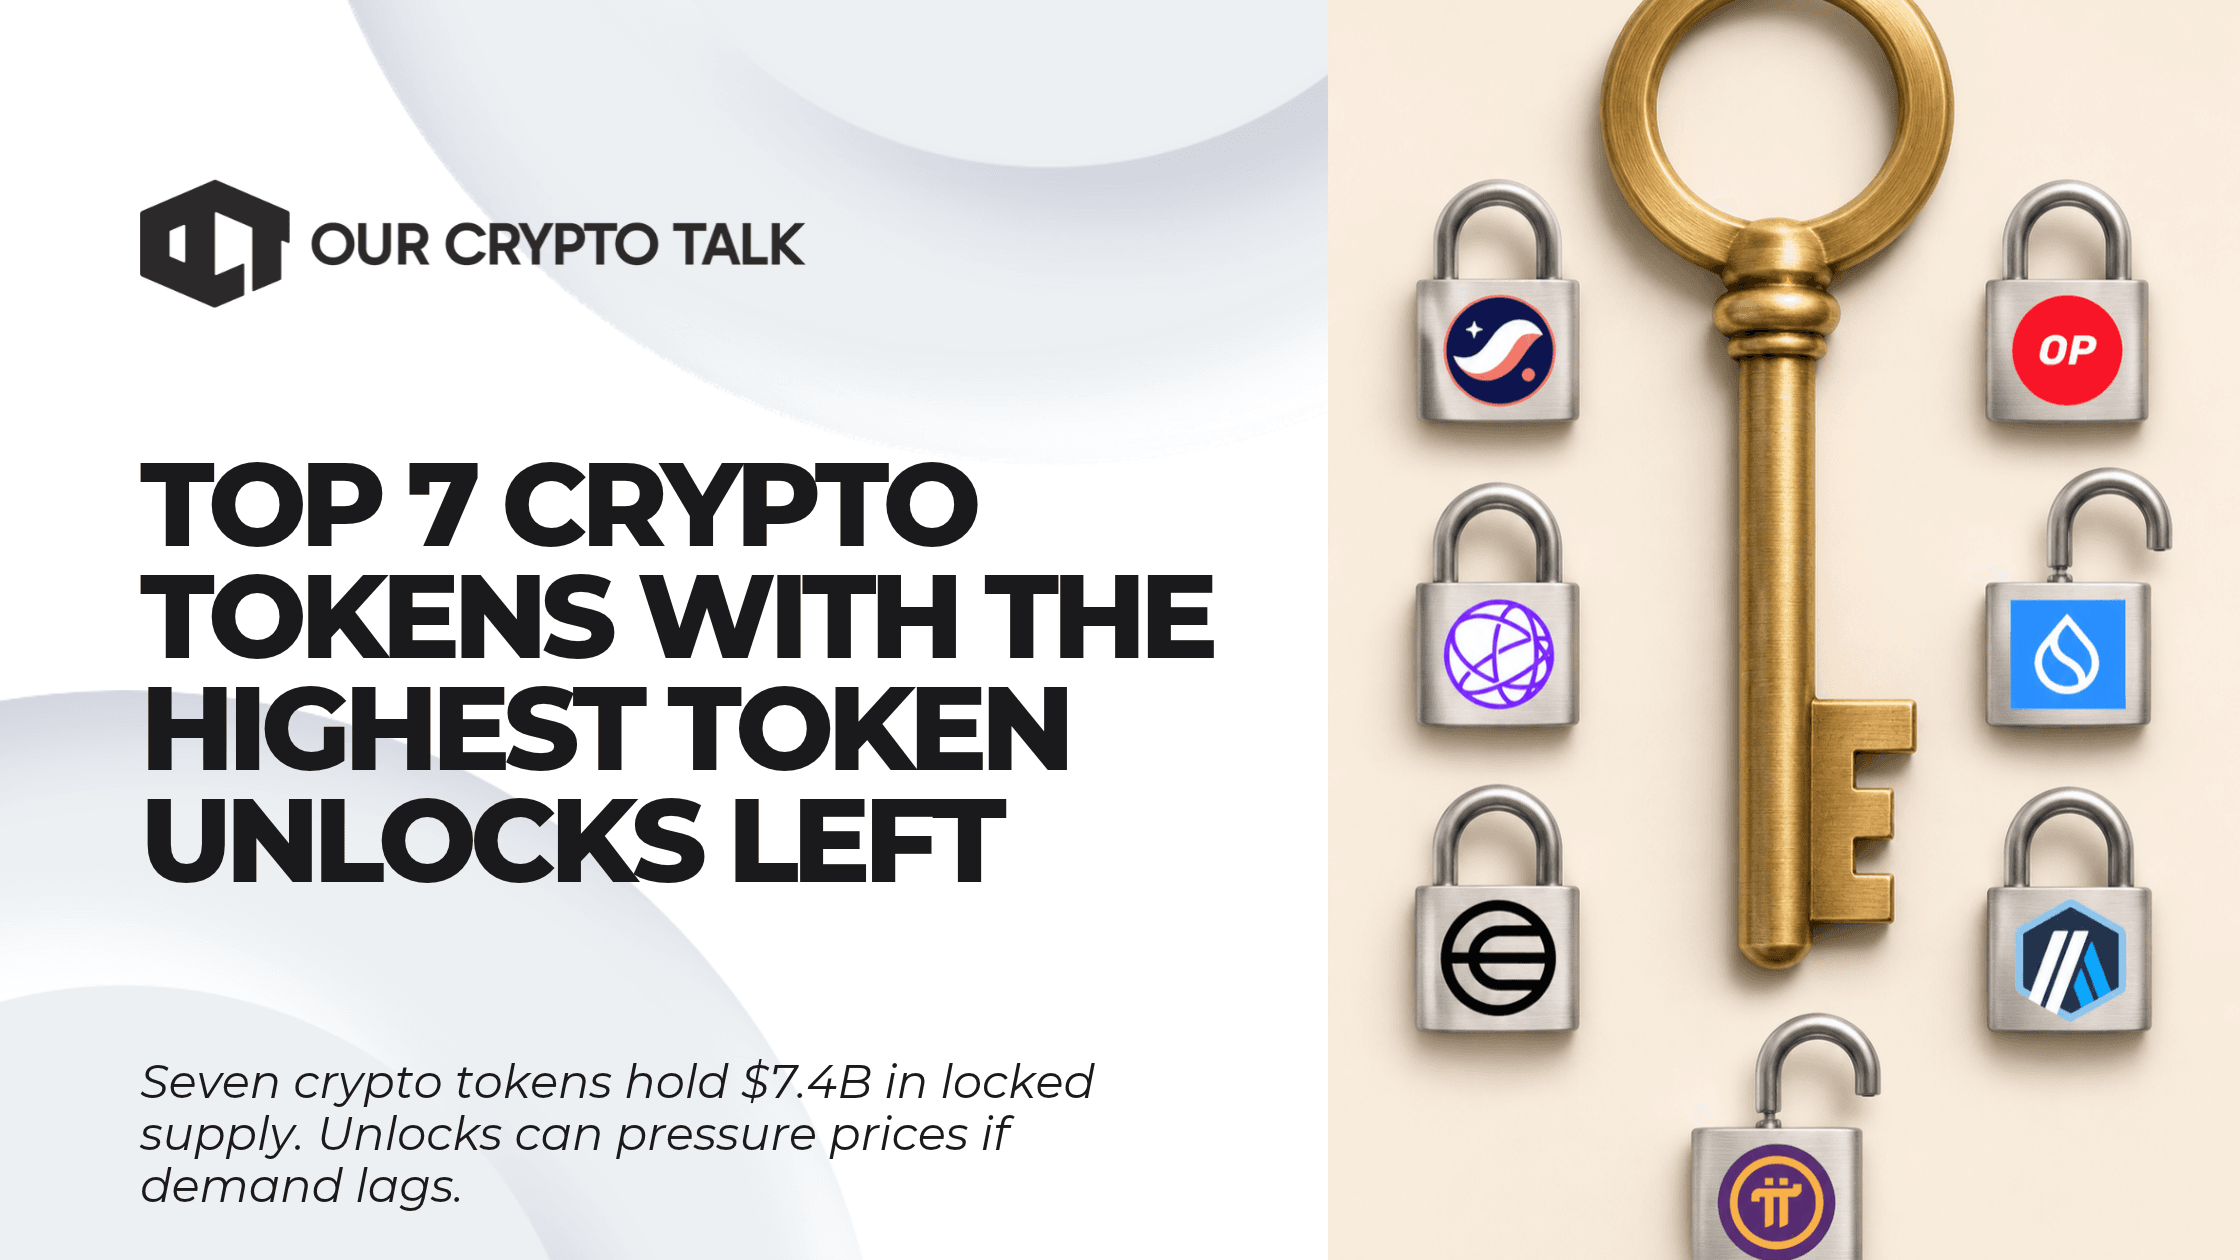
7 crypto token unlocks still carry an estimated $7.4B in locked supply. See unlock schedule and learn to gauge dilution risk before you buy.

Author: Kritika Gupta
A token with a $3 billion market cap can still have more than $4 billion in locked supply at today’s price. Token unlocks help explain when some of that supply could reach the market.
Market cap measures the value of tokens already in circulation. Fully diluted valuation (FDV), meanwhile, applies the same price to the maximum or total supply, depending on the data provider. The gap gives traders a rough sense of how much value sits outside circulation. From there, the unlock schedule shows when recipients can transfer their tokens, who gets them and how much becomes available at once.
That timing matters. A single large release can give recipients the option to sell more tokens in a short window, while smaller releases spread that potential pressure over time. This article compares seven major tokens with an estimated $7.4 billion in locked supply and shows how to judge the size of an unlock against circulating supply and trading volume.
If you only look at market cap, you’re seeing half the picture. For example, a token can have a $200 million market cap while only 20% of its maximum supply circulates. As more tokens unlock, recipients gain the option to sell. If they do, buyers may have to absorb more supply just to keep the price steady. The size of the market cap, then, tells you how much the circulating tokens are worth today. The unlock schedule shows how much more could become available over time.
To understand where that supply comes from, start with the initial allocations. Crypto projects often set aside tokens for founders, employees, early investors and ecosystem programs. From there, a vesting schedule determines when each group can transfer or sell its tokens. By spreading releases over several years, projects limit how much recipients can sell at launch. At the same time, vesting gives recipients a reason to stay involved as the project develops.
Once you know who receives the tokens, look at how the schedule spaces out the releases. With a cliff, recipients wait a set period before they gain access to a batch. For instance, an investor might receive 25% of their allocation after 12 months. With linear vesting, recipients gain access in regular increments, often daily or monthly.
In this November 2026 snapshot, seven major crypto token unlocks had an estimated $7.4 billion in locked supply at then-current prices. Sui alone accounted for about $4.3 billion, or nearly 60% of the total. Yet its monthly releases are relatively small compared with its circulating supply, because most of its remaining supply sits in an allocation that Sui set aside for after 2030.
That distinction matters when reading the ranking. It starts with the estimated dollar value of each token’s locked supply, then weighs how quickly tokens unlock and how long those releases continue. By dollar value, SUI ranks first. For near-term supply pressure, however, the size and timing of the next release can tell you more than the total still locked.
Across the rest of the list, release patterns vary. For example, Worldcoin releases WLD daily through 2038, while Arbitrum unlocks roughly 92.6 million ARB in a monthly batch. Pi, meanwhile, depends on how quickly users migrate to Mainnet and when their individual lockups expire. As a result, an unlock calendar gives readers more visibility into ARB’s next batch than into how much PI could become transferable over the same period.
The seven estimates in the table add up to $7.445 billion, or about $7.4 billion at one decimal place. Because the table values locked tokens at snapshot prices, the total can rise or fall even if the number of locked tokens stays the same. For a closer look at any one token, compare its next release with circulating supply and typical spot trading volume, then check who receives it. Those details help gauge how much supply buyers might need to absorb if recipients sell.
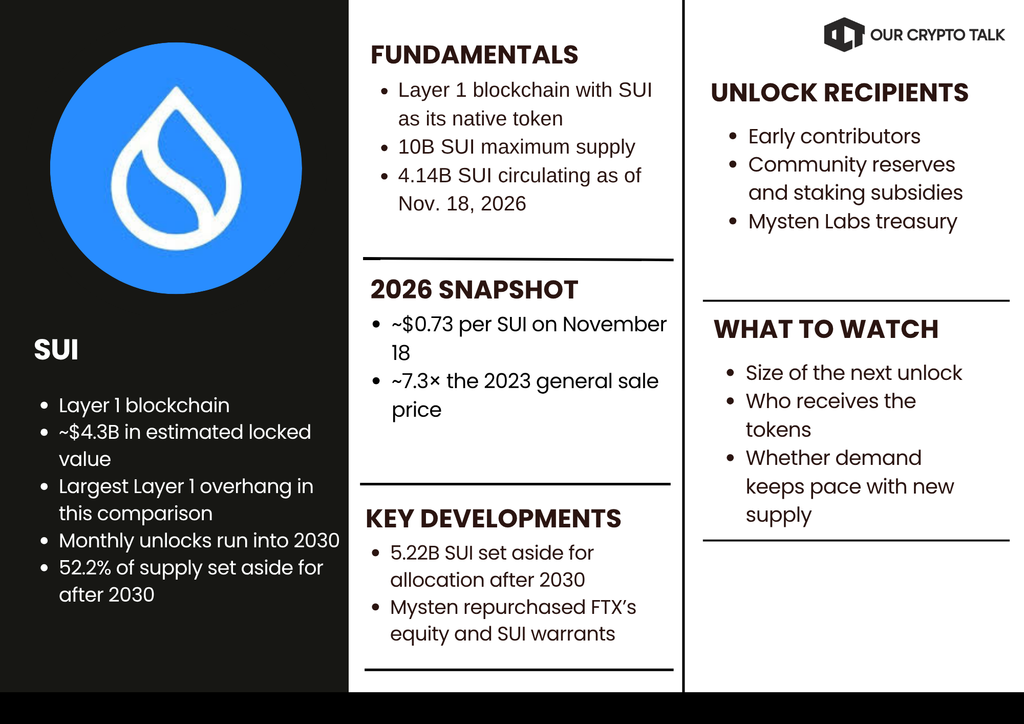
Among the Layer 1 token unlocks in this comparison, Sui has the largest estimated locked value. To put that in perspective, about 4.14 billion of its 10 billion SUI circulate, leaving roughly 5.86 billion outside circulation. At the November 18 snapshot price of about $0.73, that remaining supply represents approximately $4.3 billion. Since the estimate uses SUI’s market price, it can rise or fall even when the number of locked tokens stays the same.
The dollar figure shows the scale of the remaining supply. The published schedule, meanwhile, shows when some of it could reach the market. Through 2030, the schedule covers releases for early contributors, community reserves, staking subsidies and the Mysten Labs treasury. Beyond that window, a public filing identifies 5.22 billion SUI, or 52.2% of the maximum supply, that Sui set aside for allocation after 2030. In other words, most of the supply still outside circulation sits in that one allocation. As a result, monthly releases can remain modest even as the long-term supply overhang stays large.
Timing is only part of the story. Early sale prices also help explain why some recipients might sell once they gain access to their tokens. In 2023, KuCoin offered SUI at $0.10 in its general sale and $0.03 to allowlisted buyers. By the November snapshot, SUI traded at about 7.3 times the general sale price and 24 times the allowlist price. Those figures reflect exchange sales. In private deals, however, investors can receive several assets together. For example, FTX’s Series B investment included Mysten Labs equity and warrants for roughly 368 million SUI. Mysten later repurchased both. Because the deal bundled equity and warrants, it offers limited insight into what other venture investors paid per token.
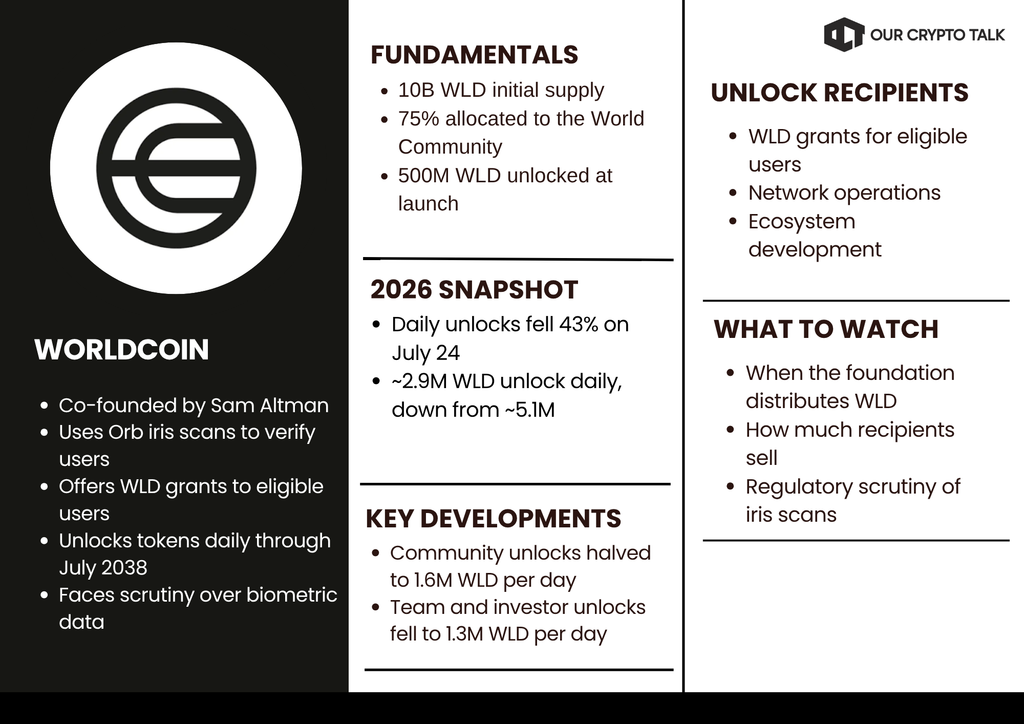
Worldcoin has one of the longest token unlock schedules in crypto. At launch in July 2023, the project unlocked 500 million WLD from its community allocation and put the remaining 9.5 billion tokens on daily vesting schedules. From there, releases stretch to July 2038, 15 years after launch. For WLD holders, the final date shows how long the supply overhang can last. The daily rate shows how quickly it can reach the market.
That rate fell on July 24, 2026. Under the existing schedule, total daily unlocks dropped 43%, from about 5.1 million to 2.9 million WLD. Within that total, community unlocks halved from 3.2 million to 1.6 million WLD per day, while team and investor releases fell from 1.9 million to 1.3 million. Even after the reduction, tokens continued to unlock daily. How much of that supply reaches exchanges depends on when the foundation distributes it and whether recipients sell.
The community allocation helps explain how some of those tokens reach users. World set aside 75% of its initial 10 billion WLD supply for what it calls the World Community. One way users can qualify for grants is through an Orb, which scans their irises to verify that they are unique humans and issue a World ID. Alongside those grants, the foundation uses part of the allocation to fund network operations and ecosystem development.
As World expanded its rollout, that link between token grants and iris scans put co-founder and OpenAI CEO Sam Altman at the center of a privacy debate. For example, Hong Kong’s privacy regulator ordered Worldcoin to stop collecting iris and facial images in 2024, while Spain temporarily halted personal data collection and processing that same year. Such restrictions can slow Orb-based sign-ups in affected markets even as daily vesting continues.
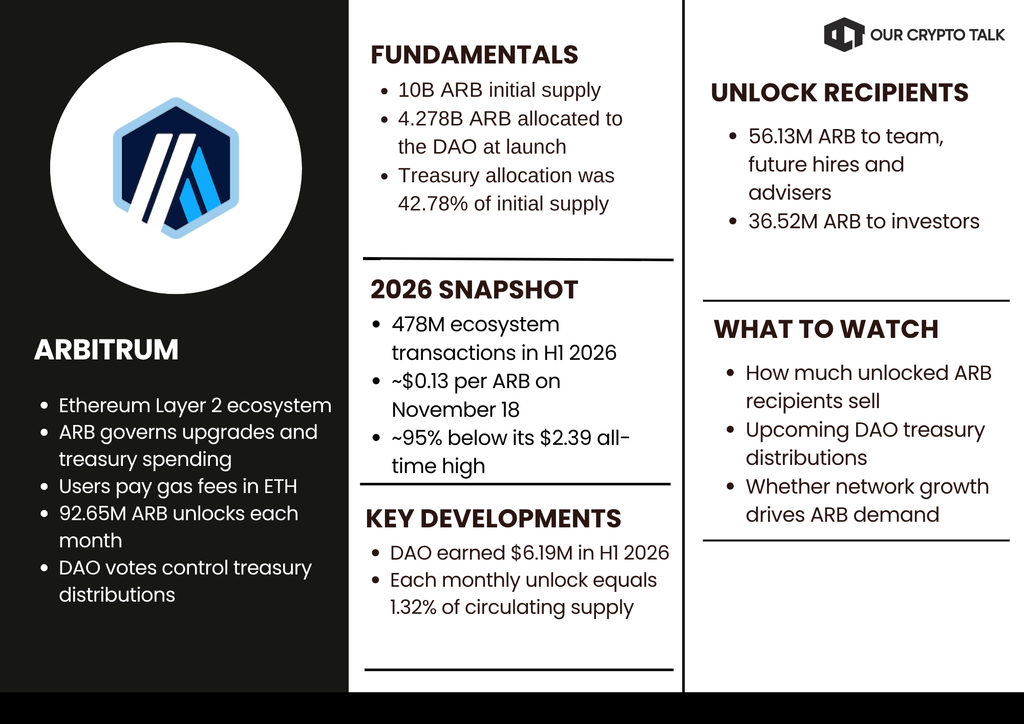
Arbitrum remains one of Ethereum’s most active Layer 2 ecosystems. In the first half of 2026, the Arbitrum Foundation reported 478 million transactions across Arbitrum One and chains that use its technology. Even with that level of activity, ARB traded near $0.13 on November 18, roughly 95% below its all-time high of $2.39.
Meanwhile, the vesting schedule releases about 92.65 million ARB each month. Of that total, 56.13 million goes to team members, future hires and advisers, while investors receive 36.52 million. At the November snapshot price, each release represents roughly $12 million, or 1.32% of circulating supply. Once the tokens unlock, recipients can hold them or sell them. That choice comes up again every month.
Against that steady flow of new supply, the question is how network activity creates demand for ARB. On Arbitrum One, users pay transaction fees in ETH. ARB holders can vote on protocol upgrades and treasury spending, but holding the token gives them no automatic claim on those fees. The Foundation reported that the DAO earned $6.19 million in the first half of 2026. That income gives the DAO more to allocate, while users can keep transacting without buying ARB.
Beyond monthly vesting, the DAO treasury can also add tokens to circulation. At launch, Arbitrum allocated 42.78% of its initial supply, or 4.278 billion ARB, to the treasury. Since then, governance votes have determined how much of that allocation the DAO distributes.
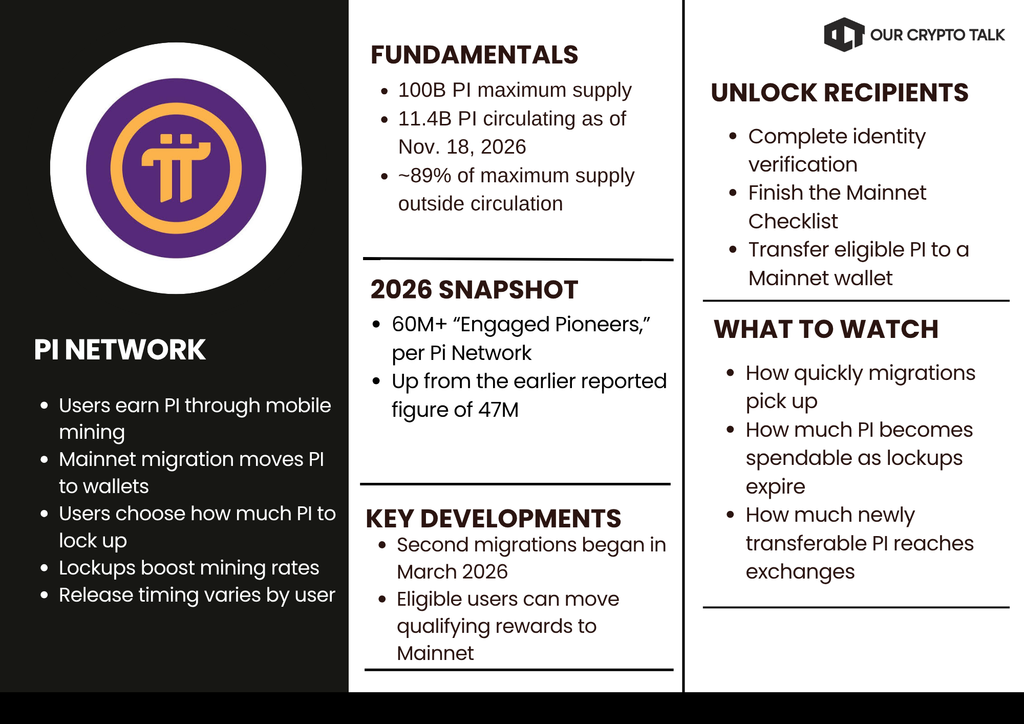
On November 18, 2026, about 11.4 billion PI circulated out of a maximum supply of 100 billion. That leaves roughly 89% of the maximum supply outside circulation. Within that gap are tokens Pi could issue in the future and balances users have already earned but cannot yet trade.
To see when some of that supply could reach the market, start with Mainnet migration. First, users complete identity verification and the Mainnet Checklist. Pi then transfers eligible balances to their wallets. Along the way, users can choose to lock up part of their PI for a mining-rate boost. As a result, two users can migrate on the same day and end up with different amounts of spendable PI. The pace of migration determines when balances reach wallets, while individual lockups determine when users can spend the locked portion.
Meanwhile, Pi Network reports more than 60 million “Engaged Pioneers,” up from the earlier figure of 47 million. That count describes the broader community. For circulating supply, what matters is how many users complete migration and how much transferable PI each brings with them. In March 2026, Pi began rolling out second migrations. Through that rollout, eligible users can move additional balances to Mainnet, including qualifying referral rewards.
If migration accelerates, more users could gain access to spendable PI in a short period. If many then move those balances to exchanges and sell, buyers may struggle to absorb the extra supply. Longer lockups could spread that pressure over time. Meanwhile, users who hold or spend PI within the ecosystem could limit immediate exchange inflows. For that reason, the figure to watch is how much transferable PI reaches wallets as migration picks up.
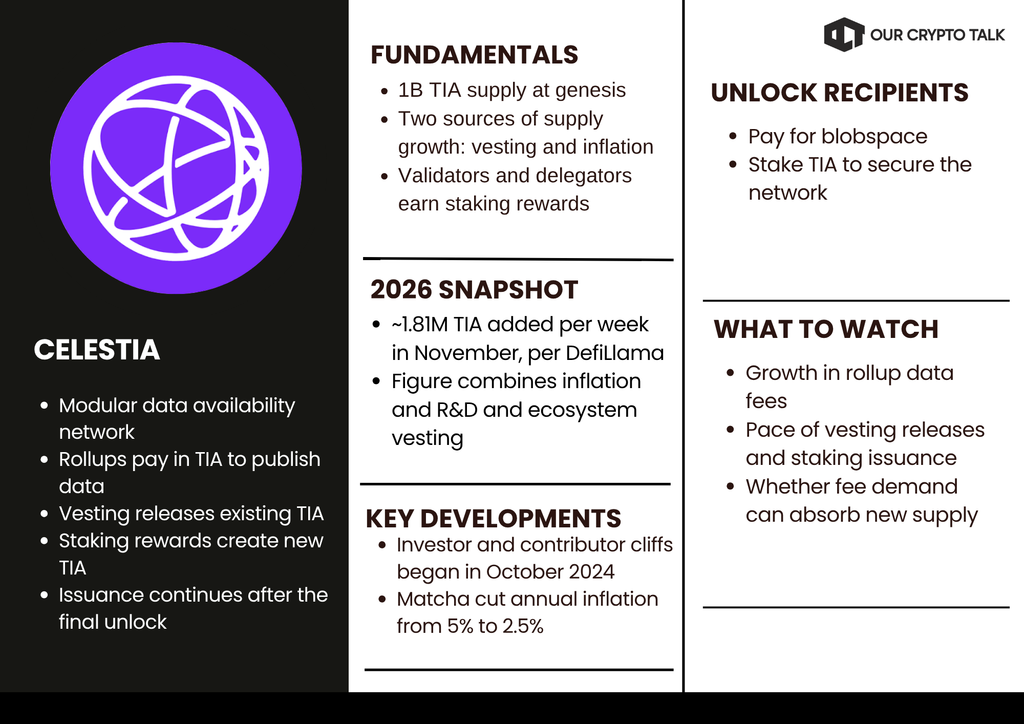
Celestia adds to TIA’s circulating supply in two ways. First, vesting releases tokens from the 1 billion TIA that existed at genesis. At the same time, Celestia issues new TIA to reward validators and delegators for securing the network. As vesting schedules wind down, fewer of the original tokens enter circulation. Meanwhile, the protocol continues to issue staking rewards. In November 2026, DefiLlama estimated that inflation and remaining R&D and ecosystem vesting together added about 1.81 million TIA per week.
To see whether that supply arrives gradually or in large batches, start with Celestia’s published vesting schedule. Some market reports described an April 1, 2026 cliff of 175.6 million TIA, or 17.2% of supply. However, Celestia’s schedule places the initial investor and contributor cliffs in October 2024. From there, those allocations vest continuously. Since the schedule lists no April cliff of that size, the reported release remains unverified.
On the demand side, Celestia gives rollups a place to publish the data others need to verify their transactions. In practice, rollups execute transactions on their own chains, then pay in TIA to publish the data on Celestia. As more rollups post data, demand for that space, known as blobspace, can grow. For TIA holders, that raises a question. Will demand from those fees keep pace with the tokens that vesting recipients and stakers may sell?
Over the longer term, the inflation rate also matters. Celestia’s Matcha upgrade cut annual inflation from 5% to 2.5%, and the issuance schedule gradually brings it toward a 1.5% floor. Even at that lower rate, a holder who keeps the same TIA balance will own a smaller share of total supply over time. Once a fixed-supply token’s vesting ends, so does the supply growth from those releases.
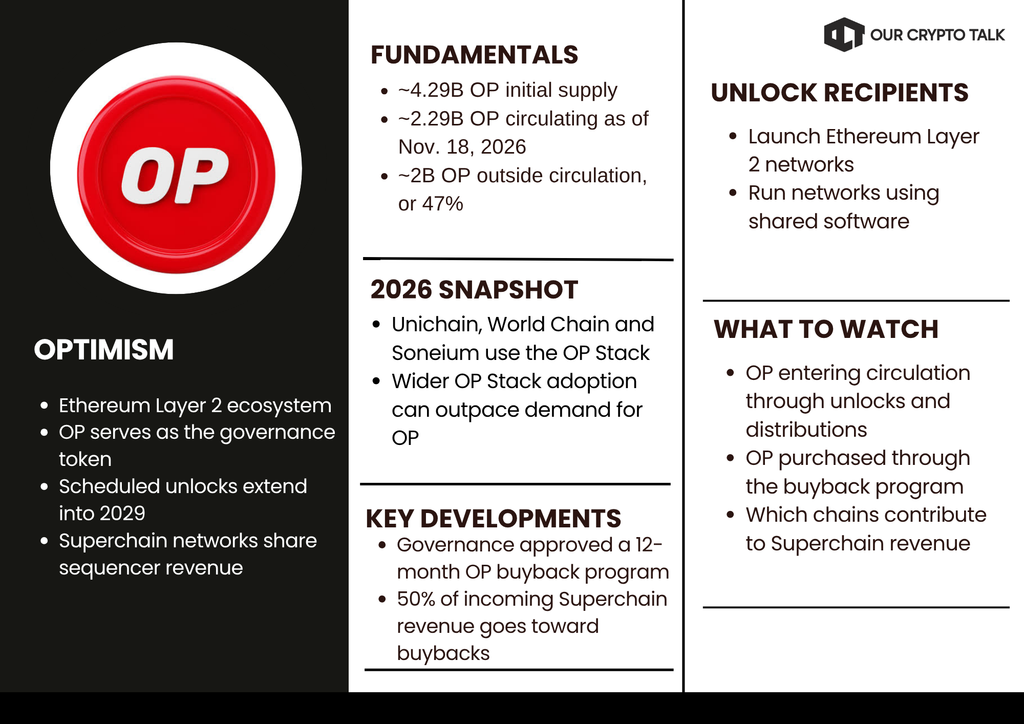
On November 18, 2026, about 2.29 billion OP circulated out of an initial supply of roughly 4.29 billion. That leaves about 2 billion OP, or nearly 47%, outside circulation. Tokenomist tracks scheduled releases into 2029. Beyond those dated releases, DefiLlama flags portions of the governance, airdrop and ecosystem allocations that lack firm release dates. For those allocations, the timing depends on when the Optimism Collective decides to distribute them.
Meanwhile, Ethereum Layer 2 networks such as Unichain, World Chain and Soneium use the OP Stack. Participating Superchain networks share a portion of their sequencer revenue with Optimism. As those chains grow, the Collective can earn more revenue even if users rarely need to buy or hold OP for everyday transactions.
That gap is the Superchain paradox. More chains can adopt the software without creating a comparable increase in demand for OP. To narrow the gap, Optimism governance approved a 12-month program that directs 50% of incoming Superchain revenue toward OP buybacks. The scale of those purchases, in turn, depends on which chains contribute and how much revenue they generate. For example, Optimism says payments under Base’s OP Enterprise agreement fall outside the buyback program.
For OP holders, that makes it worth tracking releases and buybacks over the same period. On the supply side, count how much OP enters circulation through scheduled releases and ecosystem distributions. On the demand side, check how much OP the program actually buys. Together, those figures help show how much buying pressure the program creates as more tokens enter circulation.
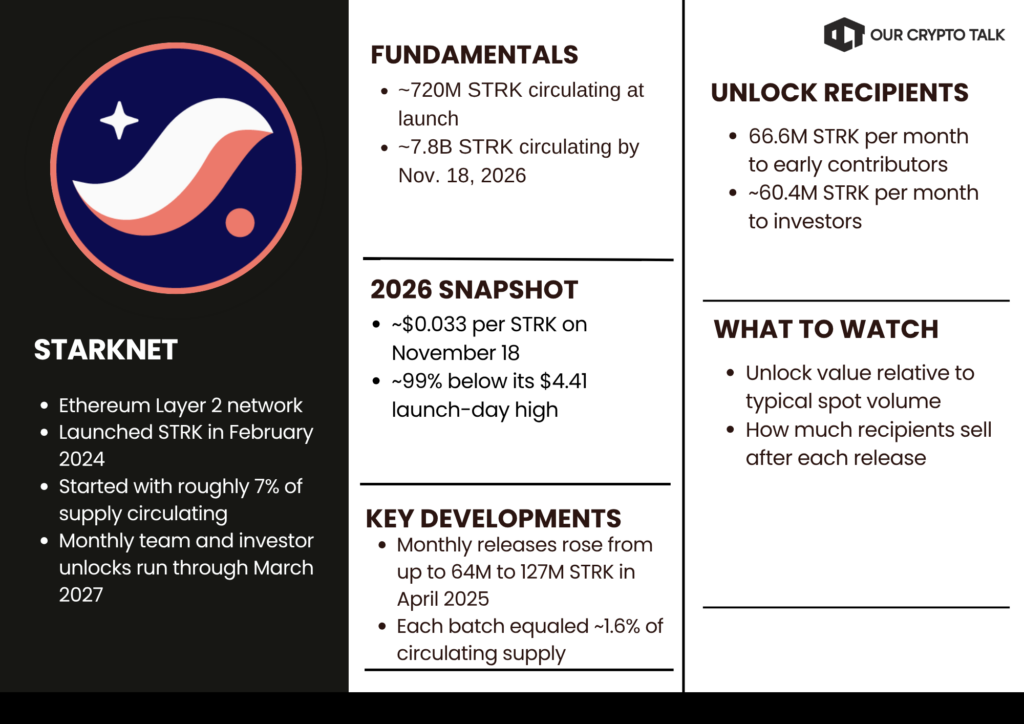
Starknet launched STRK in February 2024 with roughly 7% of its initial supply circulating. At the time, CoinGecko recorded a launch-day high of $4.41. By November 18, 2026, STRK traded near $0.033, about 99% below that peak. Meanwhile, circulating supply grew from roughly 720 million to 7.8 billion STRK. Taken together, those figures show what aggressive dilution can look like when a token launches with a small float and billions more tokens enter circulation over the following years.
Part of that supply growth came from early contributor and investor vesting. Initially, the schedule released up to 64 million STRK per month. Then, in April 2025, the monthly release nearly doubled to 127 million STRK, with batches scheduled through March 2027. Of each batch, early contributors gain access to about 66.6 million STRK, while investors gain access to another 60.4 million. At the November snapshot price, each batch was worth roughly $4.2 million. Once those tokens unlock, recipients decide how much to hold and how much to sell.
As more STRK entered circulation, its market-cap-to-FDV ratio climbed from about 0.07 at launch to roughly 0.77 in November. Because both valuations use the same token price, price cancels out when you divide one by the other. Instead, the increase reflects growth in circulating supply as a share of the supply that FDV counts. In other words, the ratio registered more of STRK’s supply entering circulation even as the token traded at a fraction of its launch-day price.
For the next unlock, start with the size of the release. At the November snapshot, 127 million STRK equaled roughly 1.6% of circulating supply. From there, compare its dollar value with typical spot trading volume and check who receives the tokens.
Start with the next 30 to 90 days. For each token in your portfolio, record the unlock date, the number of tokens due for release and who receives them. Then use those details to gauge how much supply could reach the market.
Token unlocks are part of how crypto projects fund development, reward early contributors and bring investors on board. By spreading those allocations over time, vesting gives recipients a reason to stay involved. For buyers, though, each release raises a practical question. How much of that supply could reach the market, and is there enough demand to absorb it?
A low-float token can still be a good investment if protocol growth creates demand for the token itself. For example, more transactions can support demand when users need the token to pay fees. If demand stalls while unlocks continue, however, prices can come under pressure. Starknet illustrates how steep the drawdown can get. As more STRK entered circulation, its price fell about 99% from its launch-day high.
Before you buy, start with the next unlock and check who receives the tokens. Then compare the release with circulating supply and typical spot trading volume. From there, look at what unlocks over the following 90 days. One release may look manageable on its own, but several in quick succession can give buyers less time to absorb the extra supply.
This article is for education and research, not financial advice.


Top 7 Crypto Tokens with the Highest Token Unlocks Left
Bitcoin Midterm Crash: Every Q4 Selloff Since 2014
AI Needs Private Inference. Can Nesa Deliver?
How to Farm Perpdex Without Getting Wrecked – Monk’s Method 2.0
Top 7 Crypto Tokens with the Highest Token Unlocks Left
Bitcoin Midterm Crash: Every Q4 Selloff Since 2014
AI Needs Private Inference. Can Nesa Deliver?
How to Farm Perpdex Without Getting Wrecked – Monk’s Method 2.0