
Explore Bitcoin midterm year Q4 crashes, historical returns and the key factors shaping BTC’s selloff and potential recovery.

Author: Kritika Gupta
The Bitcoin midterm year selloff deepened on November 15, 2026, as BTC fell to roughly $62,000, its lowest level since mid-July. A weekend liquidation cascade wiped out about $2 billion in leveraged positions, mostly longs. Although Bitcoin later rebounded toward $65,000, the decline extended its losing streak to six weeks and pushed BTC below its 200-day and 200-week moving averages.
For crypto readers who have followed previous cycles, the setup looks familiar. Every completed U.S. midterm-year Q4 since 2014 has delivered a Bitcoin decline: roughly 16.7% in 2014, 42.2% in 2018 and 14.7% in 2022. Meanwhile, Q4 2026 has already lost more than 20% from the September 30 close, putting another steep quarterly decline within reach.
These selloffs have repeatedly coincided with the later stages of Bitcoin’s four-year cycle, when post-halving momentum fades and selling pressure builds. The question now is whether 2026 follows that familiar path or whether several overlapping pressures produce a different outcome. Those pressures include a record exchange hack, a Democratic midterm sweep, a tech-sector crisis, shrinking stablecoin liquidity and continued Federal Reserve tightening.
Several events drove Bitcoin’s Q4 2026 selloff. First, on October 29, attackers drained roughly $6.3 billion from Binance hot wallets across ten blockchains in about 20 minutes. Blockchain analysts and the FBI linked the attack to North Korea’s TraderTraitor group, describing it as the largest crypto theft on record.
Binance said it would cover the losses through its SAFU fund and corporate treasury. Subsequent freezes restricted access to roughly $2.7 billion to $3 billion. Nevertheless, the attack shook confidence in centralized exchanges, and Bitcoin briefly touched the mid-$70,000s before stabilizing.
Then, on November 3, Democrats won control of both the House and Senate in the U.S. midterm elections, flipping seats in Texas, Kansas, South Carolina, Ohio, Iowa and Maine. Although markets had anticipated political uncertainty, the scale of the shift raised fresh questions about crypto policy and regulation.
Two days later, a tech selloff added pressure. The Nasdaq dropped sharply, semiconductor stocks fell and Bitcoin followed equities lower. On November 11, MSCI confirmed plans to remove Strategy, formerly MicroStrategy, and other digital-asset treasury companies from its global indexes after the November 30 close. MSCI cited new rules for non-operating companies, while analysts had previously estimated that index exclusions could trigger several billion dollars in passive outflows.
The following day, Nvidia CEO Jensen Huang resigned amid reports alleging personal relationships involving a Chinese intelligence asset and a direct report. Nvidia shares fell as much as 12%, wiping out hundreds of billions of dollars in market value and adding pressure across risk assets. Bitcoin subsequently dropped toward the low $70,000s.
Finally, a hotter-than-expected CPI reading on November 13 increased expectations for another Federal Reserve rate hike. Over November 14 and 15, Bitcoin broke below its 200-day moving average near $73,000 and its 200-week average near $68,000. Those breaks triggered forced selling, which drove BTC toward $62,000.
Meanwhile, spot Bitcoin ETFs recorded roughly $1.9 billion in net outflows over seven consecutive trading sessions through November 13, with IBIT accounting for most of the withdrawals. Stablecoin supply also shrank by $12 billion to $14 billion over 30 days, marking its steepest contraction since 2022 and reducing available dollar liquidity across crypto markets.
By mid-November, Bitcoin traded roughly 50% below its October 6, 2025 all-time high near $126,000 to $126,200.
Bitcoin’s cycle peak and the October–November 2026 selloff
Bitcoin recorded losses in each of the three completed midterm-year fourth quarters since 2014. Although the catalysts differed, every episode followed a period of weakening cycle momentum.
Bitcoin midterm year performance and market context
In 2014, traders continued to absorb the fallout from Mt. Gox’s February collapse. Bitcoin had already fallen sharply from its late-2013 peak, and Q4 extended the decline.
Similarly, the 2018 selloff followed months of weakness after the ICO boom. The Bitcoin Cash hash war in November and the SEC’s rejection of a high-profile ETF application added further pressure. Bitcoin eventually bottomed near $3,200 in December.
In 2022, FTX’s November bankruptcy pushed Bitcoin toward $15,500 as exchange failures and credit losses spread through the industry. Across all three episodes, the market had already lost momentum before the final Q4 selloff.
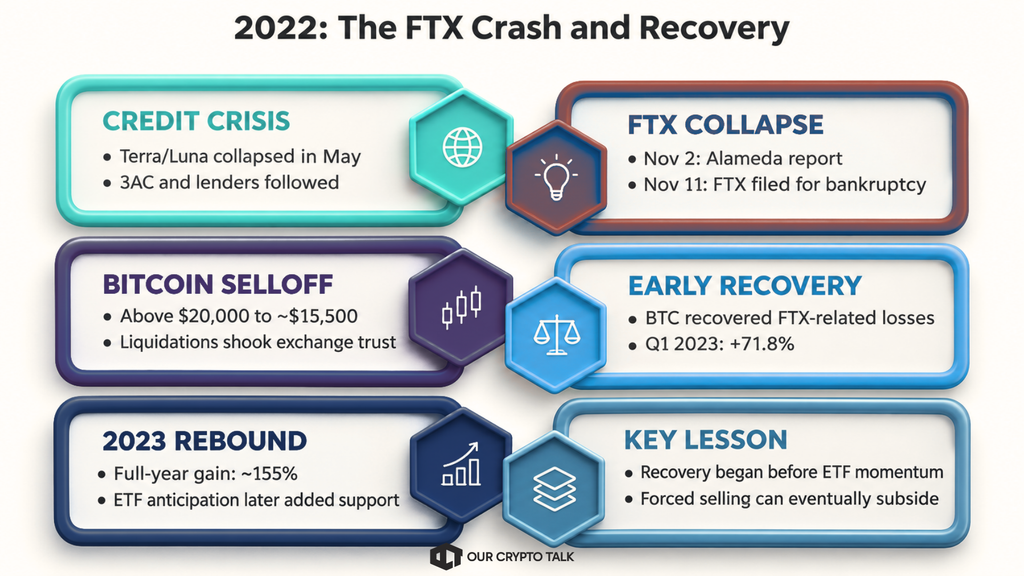
The 2022 sequence offers a useful comparison because Bitcoin absorbed several shocks before FTX collapsed. Terra/Luna failed in May, followed by Three Arrows Capital and financial distress across major crypto lenders. As a result, the industry spent much of the summer unwinding leverage, managing withdrawals and absorbing credit losses.
The quarterly returns show how much damage preceded the final selloff. Bitcoin lost approximately 1.5% in Q1 2022, then plunged 56.2% in Q2 as the Terra crisis spread through interconnected trading firms and lenders. During that decline, BTC touched roughly $17,600. By the time the market entered the second half of the year, investors had already reduced exposure substantially.
Q3 brought temporary stability rather than a convincing recovery. Bitcoin lost approximately 2.6% over the quarter and ended September around $19,000 to $20,000. Although selling slowed, the earlier failures left traders sensitive to signs of another liquidity crisis. FTX subsequently supplied that trigger.
On November 2, CoinDesk published its report on Alameda Research’s balance sheet, raising questions about the trading firm’s exposure to FTT and its relationship with FTX. Binance then announced plans to sell its FTT holdings on November 6. Customers rushed to withdraw funds, FTX halted withdrawals on November 8, and the exchange filed for bankruptcy on November 11.
Within days, Bitcoin fell from above $20,000 toward the mid-$15,000s. Liquidations accelerated the decline, while uncertainty around exchange reserves and counterparty exposure weakened confidence across centralized platforms. Unlike a routine correction, the FTX collapse forced traders to reassess whether they could access assets they held through intermediaries.
The timing also placed the crisis directly around the U.S. midterm election on November 8. Republicans won control of the House, while Democrats retained the Senate. However, the overlap does not establish that the election caused Bitcoin’s decline. FTX’s withdrawal freeze, bankruptcy and subsequent contagion provided a much clearer explanation for the immediate selling pressure.
Bitcoin eventually reached approximately $15,476 on November 21, roughly 77% below its November 2021 all-time high near $69,000. That low arrived 13 days after the midterm vote. Despite the severity of the FTX shock, BTC finished Q4 down approximately 14.7%, a smaller quarterly decline than Q2’s 56.2% loss. Earlier selling had already removed a substantial share of Bitcoin’s market value before FTX failed.
The recovery then developed faster than many traders expected. Bitcoin did not revisit its November low. By January 14, 2023, BTC had reached approximately $21,095, recovering its FTX-related price losses roughly two months after the bankruptcy. That recovery did not resolve creditor claims or repair the failed exchange. Instead, it showed that Bitcoin’s market price could recover while the legal and financial consequences continued.
By March 31, Bitcoin traded near $28,400, completing a Q1 gain of approximately 71.8% to 72%. The contrast with earlier midterm cycles was substantial. Q1 2015 delivered further losses, while Q1 2019 produced a modest recovery. In 2023, buyers returned strongly enough to reverse the final phase of the previous year’s decline within one quarter.
Later, anticipation around spot Bitcoin ETFs helped sustain the rally. However, the initial rebound began before ETF expectations became a dominant market narrative. Bitcoin ended 2023 near $42,000, delivering a full-year gain of roughly 155% to 156%.
The episode highlights an important distinction between a damaging event and continued selling pressure. FTX severely weakened trust, but its collapse did not keep Bitcoin falling indefinitely. Once forced selling eased and buyers absorbed the remaining supply, the market recovered. For comparisons with 2026, the useful question is whether liquidity and demand can improve after a shock, rather than whether the shock matches FTX in scale or timing.
Bitcoin’s 2022 bear market, FTX collapse and recovery
Case Study: 2026 (What’s Happened So Far)
The 2026 drawdown has followed a different path from Bitcoin’s previous midterm-year selloffs. After reaching its cycle high near $126,000 in early October 2025, Bitcoin declined over several quarters. Losses from Q4 2025 through Q2 2026 weakened the market before a Q3 relief rally restored some confidence. However, renewed selling in Q4 challenged the idea that the recovery could sustain itself.
That sequence matters because the latest decline started within an existing bear market. Traders who bought the Q3 rebound faced another reversal, while longer-term holders continued to absorb losses from the 2025 peak. Consequently, the October and November shocks hit a market that had already endured months of pressure.
October provided an early warning. The supplied figures show Bitcoin falling from roughly $81,800 toward $76,300 during the month. The weakness also challenged expectations around “Uptober,” the market’s nickname for Bitcoin’s historically strong October performance. Instead of delivering a sustained seasonal rally, BTC entered November with fragile momentum.
The subsequent rebound toward $81,000 on November 4 briefly suggested that buyers could regain control. However, Bitcoin failed to hold above $80,000. Its later fall toward $62,081 represented a decline of roughly 23% from that relief-rally high. For traders, the failed bounce mattered as much as the initial weakness: buyers could lift the price temporarily, but they could not sustain demand as new pressures emerged.
Unlike the final phase of the 2022 selloff, several developments now overlap. The Binance hack weakened confidence in exchange security. Political changes added uncertainty around the direction of U.S. crypto legislation. Meanwhile, weakness across technology stocks encouraged investors to reduce exposure to risk assets, including Bitcoin.
These pressures operate through different channels. An exchange security failure can encourage withdrawals and reduce traders’ willingness to keep capital on centralized platforms. A technology-stock selloff can trigger broader portfolio reductions. Political uncertainty can delay investment decisions even when it does not immediately change the rules governing crypto. Together, those forces can weaken demand while existing holders continue to sell.
ETF flows provide another important distinction from 2022. U.S. spot Bitcoin ETFs now give investors a direct route to increase or reduce exposure through traditional brokerage accounts. The supplied figures put net outflows near $1.9 billion across seven trading sessions. Those withdrawals suggest that demand through this channel weakened during the selloff.
Nevertheless, ETF outflows alone cannot explain every price move. Traders also need to consider spot exchange activity, derivatives positioning and the timing of fund transactions. Persistent withdrawals matter most when other buyers fail to absorb the accompanying selling pressure.
Stablecoin contraction adds a separate liquidity concern. The draft’s figures show supply shrinking by roughly $12 billion to $14 billion over 30 days. Stablecoins support trading, collateral and settlement across crypto markets, so a contraction can indicate that capital is leaving the ecosystem. However, stablecoin supply does not measure Bitcoin buying power precisely, since holders also use these assets for payments, lending and other activities.
At the same time, liquidations amplified the decline. As Bitcoin broke important technical levels, leveraged traders faced margin calls and forced position closures. That selling pushed prices lower, which then exposed additional positions to liquidation. The resulting cascade helps explain how a gradual deterioration can become a sharp weekend move.
The drawdown’s size provides context without identifying a bottom. At approximately $62,000, Bitcoin traded roughly 51% below its $126,000 peak. Previous cycles suffered deeper peak-to-trough losses, often exceeding 70%. However, those historical declines neither require Bitcoin to fall further nor establish that the current price offers support.
The next major reference point remains the July 2026 low near $57,700 to $58,500. A sustained hold above that area, alongside improving ETF flows and stabilizing liquidity, would strengthen the recovery case. Conversely, a decisive break would undermine the argument that July marked the cycle bottom.
Ultimately, the 2026 case involves more than another midterm-year Q4 decline. It combines an extended drawdown, a failed relief rally, weaker investment flows and forced selling. Whether Bitcoin follows those pressures with a recovery will depend on renewed demand and improving liquidity, rather than the election calendar alone.
Benjamin Cowen has argued that Bitcoin’s cycle lows typically arrive 25 to 30 months after a halving, with midterm timing reflecting coincidence rather than a direct election effect. The April 2024 halving places late 2026 roughly 30 to 31 months later, near the upper end of or just beyond that proposed window.
Previous bottoms in January 2015, December 2018 and November 2022 also clustered around the midterm calendar. However, Cowen attributes that timing primarily to Bitcoin’s supply cycle and liquidity conditions rather than election outcomes. He also notes that equities have not always followed the same pattern.
On the other hand, elections can influence actual trading decisions. Changes in congressional control can alter regulatory expectations, while policy uncertainty can encourage investors to reduce risk.
Both influences could affect Bitcoin simultaneously. Still, their overlap does not establish a stronger predictive signal. Three completed midterm-year Q4 observations offer too little evidence to prove causation or reliably forecast a bottom.
Bitcoin’s first-quarter performance after previous midterm-year selloffs has varied considerably:
The simple average sits near 18% to 19%. However, that figure masks a wide gap between further losses and a strong recovery.
For Q1 2027, continued ETF outflows, further stablecoin contraction and additional Fed tightening would increase the risk of prolonged weakness. A break below the 2026 summer lows would add to that pressure.
Conversely, easing leverage, improving ETF flows and stablecoin supply growth could support a rebound. A softer Fed stance could also help restore risk appetite. The direction of those indicators will offer more useful evidence than the calendar alone.
Bitcoin’s Q1 performance after midterm-year Q4 selloffs
Looking beyond the next quarter reveals a more consistent recovery pattern. Bitcoin eventually gained ground after each of the three completed midterm-year Q4 selloffs, although the reported returns vary with the measurement window.
Approximate figures range from 23% to 34% after 2014, 45% to 92% after 2018 and 93% to 155% after 2022. However, those ranges use different starting points and end dates, so they do not support a clean comparison or a reliable average without a consistent methodology.
Broader equity-market history also suggests strength after midterms. Historical summaries indicate that the S&P 500 has avoided a negative return over the following 12 months after every midterm election since 1939. Nevertheless, Bitcoin operates within a different market structure, and equity performance cannot guarantee a crypto recovery.
The historical record therefore offers a stronger argument for eventual recovery than for immediate relief. Even then, the small Bitcoin sample limits how much confidence traders should place in the pattern.
Bear case. Continued Fed tightening, shrinking stablecoin liquidity and persistent spot ETF outflows could extend the selloff. Meanwhile, Nvidia’s leadership crisis has added pressure to a tech sector that already faces heavy selling. Several shocks now reinforce one another, which makes a reversal harder to tie to any single development. Traders will likely watch the $58,500 to $60,000 area closely. A decisive break would increase the risk of further downside.
Bull case. The liquidation cascade has cleared substantial leverage, while extreme-fear readings suggest deeply negative sentiment. In addition, spot Bitcoin ETFs provide an established channel for renewed demand if flows improve. The timing also sits near historical post-halving bottoming periods. If Bitcoin holds its July low and ETF flows turn positive, those developments would strengthen the case for a recovery after the recent forced selling.
Bitcoin declined in Q4 during every completed U.S. midterm year since 2014. So far, 2026 has followed the same direction. However, three completed observations cannot establish a dependable trading rule.
Previous cycles also show that recovery timing varies widely. Bitcoin lost roughly 24% in Q1 2015 but gained about 72% in Q1 2023. That range leaves plenty of room for either continued weakness or a sharp rebound in Q1 2027.
For crypto readers, the practical indicators remain clear: Fed policy, spot Bitcoin ETF flows, stablecoin supply and BTC’s behavior around the 2026 summer low near $58,500. Improving liquidity and sustained support would strengthen the recovery case. Continued outflows and a break below that area would weaken it.
History provides context. The next changes in liquidity, demand and price structure will show whether Bitcoin has begun to recover.
This article is historical analysis, not financial advice. Three completed cycles is a small sample and past patterns do not guarantee future results.


Bitcoin Midterm Crash: Every Q4 Selloff Since 2014
AI Needs Private Inference. Can Nesa Deliver?
How to Farm Perpdex Without Getting Wrecked – Monk’s Method 2.0
Hyperliquid Liquid Staking Is Growing. Can Kinetiq Stay Ahead?
Bitcoin Midterm Crash: Every Q4 Selloff Since 2014
AI Needs Private Inference. Can Nesa Deliver?
How to Farm Perpdex Without Getting Wrecked – Monk’s Method 2.0
Hyperliquid Liquid Staking Is Growing. Can Kinetiq Stay Ahead?