Discover the top 7 Altseason indicators for 2025, from ETF inflows to Bitcoin dominance shifts, to stay ahead of the next altcoin rally.
Author: Chirag Sharma
Altseason indicators are on-chain, macroeconomic, and sentiment signals that historically precede periods when altcoins outperform Bitcoin. In 2025, seven key indicators point to a potential altcoin rally: Ethereum ETF inflows surpassing $9 billion, Bitcoin dominance declining from 65% to 59.3%, and altcoin-related Google searches reaching their highest level since 2021.
As we step into the second half of 2025, the spotlight is gradually shifting. Bitcoin surged past the $100,000 mark earlier this year, driven by institutional adoption, global economic uncertainties, and growing acceptance of digital assets. Now, seasoned investors and newcomers alike are asking: Is Altseason next?
Historically, Altseasons tend to follow major Bitcoin bull runs. Capital first flows into BTC, then into Ethereum, and eventually into smaller altcoins, creating ripple effects across the market. This rotation pattern reflects investor appetite for risk and higher returns.
Altseason (short for “altcoin season”) is a market phase where altcoins collectively outperform Bitcoin over a sustained period, typically lasting between 4 and 12 weeks. During this phase, capital rotates from Bitcoin into higher-risk cryptocurrencies, driving strong gains across sectors like DeFi, Layer 1 protocols, and emerging narratives such as AI and DePIN.
Altseason usually follows a major Bitcoin rally. Once Bitcoin stabilizes at a new price range, investors begin reallocating profits into altcoins in search of higher returns. This shift reflects increased risk appetite and expanding market liquidity.
The last confirmed altseason occurred in early 2021, when Bitcoin dominance dropped from around 70% to below 40%, triggering widespread gains across the altcoin market.
Identifying altseason early gives investors a timing advantage. The indicators below help track capital flows, sentiment shifts, and macro conditions that historically precede these rallies.
This article outlines the top seven Altseason indicators that traders and investors should monitor in 2025. Each signal provides insights into sentiment, liquidity, and market momentum. When these indicators align, they often precede explosive altcoin rallies. Let’s dive into them.
One of the most reliable early Altseason indicators of an approaching altcoin rally is the influx of capital into Ethereum Exchange-Traded Funds (ETFs). These investment vehicles provide both institutional and retail investors a regulated, accessible way to gain exposure to Ethereum without directly managing wallets or keys. Since their approval in mid-2024, ETH ETFs have reshaped how the market perceives Ethereum’s long-term viability.
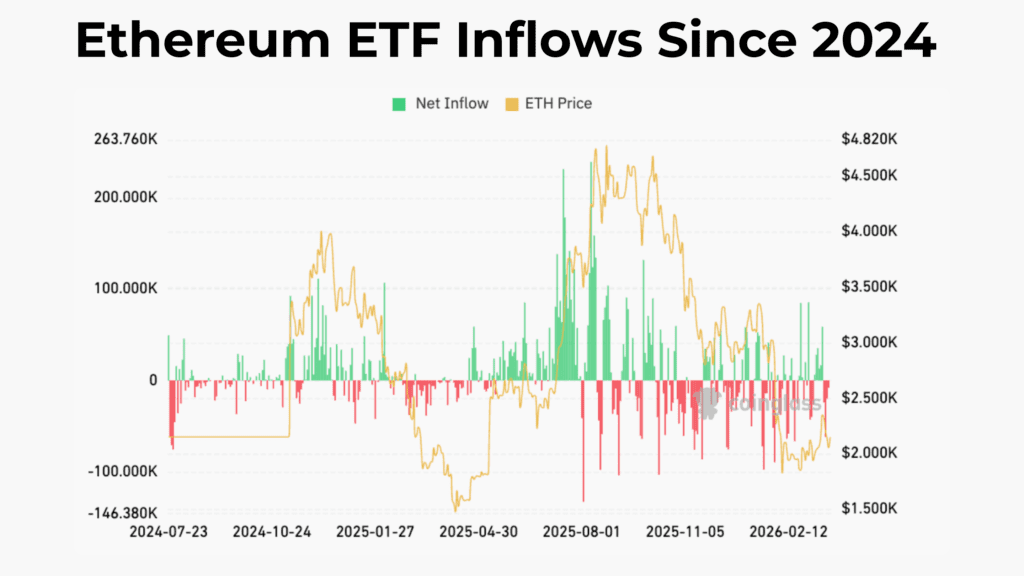
As of July 2025, net inflows into Ethereum spot ETFs have reached approximately $9 billion, despite some volatility and short-term outflows. For instance, on July 25, ETH ETFs saw a net inflow of +5.10K ETH, which was followed by a brief period of outflows. However, the broader accumulation trend remains strong, reflecting growing institutional confidence.
Standard Chartered analyst Geoff Kendrick projects Ethereum could reach $15,000 if monthly ETF inflows exceed $2.3 billion. Ethereum’s 10-year anniversary this year has added symbolic weight to its performance, reinforcing its leadership role among altcoins.
Ethereum is often seen as the gateway to Altseason. Once capital rotates from Bitcoin into ETH, it tends to spread into smaller-cap tokens across DeFi, NFTs, and infrastructure projects. In this way, Ethereum ETF inflows serve as a broader indicator of rising interest in the altcoin ecosystem. If regulatory clarity continues to improve and capital inflows accelerate, expect ETH’s momentum to pull up the entire altcoin market signaling the start of Altseason.
The Bitcoin Dominance (BTC.D) chart measures Bitcoin’s market share relative to the overall cryptocurrency market cap. It’s a classic metric used to identify shifts in capital allocation between Bitcoin and altcoins. When BTC.D declines, it typically suggests investors are reallocating funds from Bitcoin into alternative assets in search of higher returns.
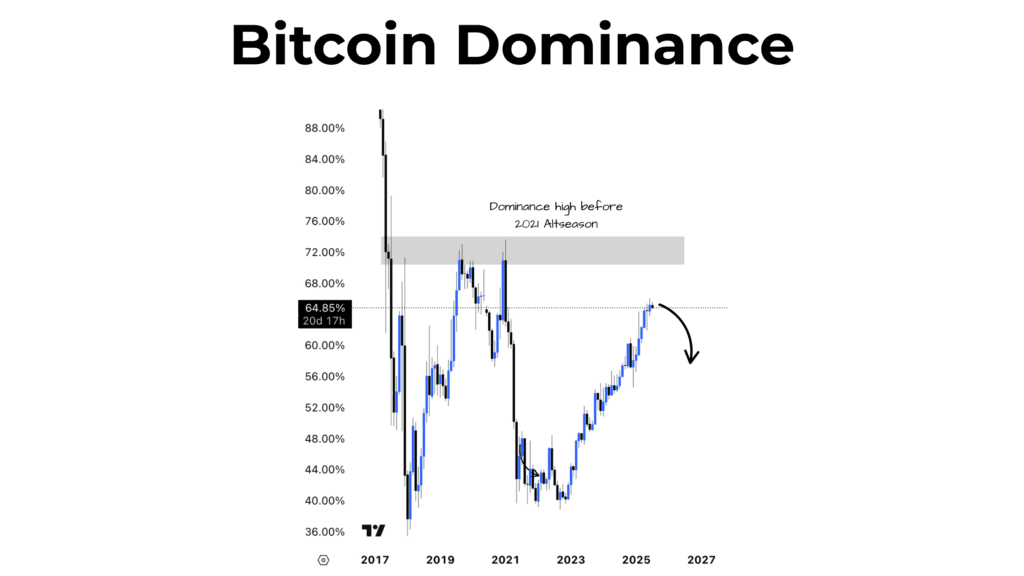
In August 2025, Bitcoin’s dominance is hovering around 59.3%, down from a local high of 65% earlier this year. This decline is significant, it shows early signs of market rotation. While still above its 12-year average, a sustained drop below 55% would be a strong confirmation that Altseason is underway.
During the 2021 Altseason, BTC dominance fell below 50%, triggering massive gains across altcoins like Solana, Cardano, and Chainlink. A similar trend could unfold in 2025 if Bitcoin’s price stabilizes or enters a short-term consolidation phase.
Investors and traders can track BTC.D on platforms like CoinMarketCap or TradingView, which allow for customizable alerts and real-time charting. A falling BTC.D often coincides with rising altcoin volume and market cap, a dynamic that fuels rapid price appreciation in mid- and small-cap tokens.
In summary, if Bitcoin’s dominance continues to decline while its price remains steady or mildly bullish, it’s one of the strongest early altseason indicators that market momentum is shifting toward altcoins.
While Bitcoin dominance measures capital concentration in BTC, altcoin dominance tells the other half of the story, how much of the market is being captured by altcoins. Often calculated as 100% minus BTC.D and ETH dominance, this indicator reveals how deeply capital is penetrating beyond the top two coins.
As of mid-2025, altcoin dominance is on a notable upward trajectory. We’ve seen a 15% surge in altcoin prices over the past month, coupled with $200 million in new inflows into altcoin markets. This kind of data often signals the beginning stages of Altseason. As of July 2025, it remains relatively low but is trending upward.
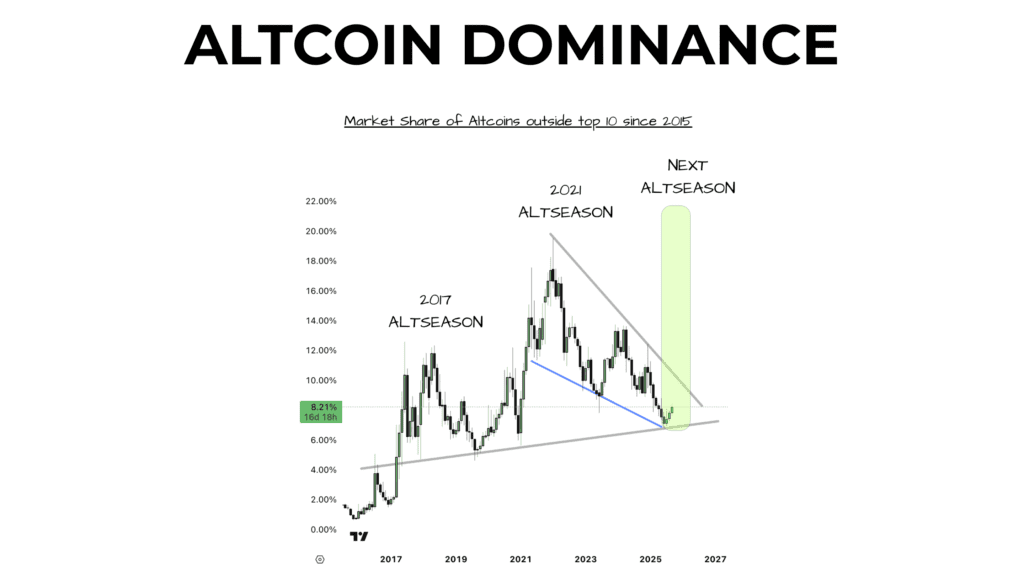
Platforms like TradingView, Bitget, and CoinMarketCap’s Altcoin Season Index offer visual tools to track this movement. These tools aggregate performance data from a broad set of altcoins and measure whether they’re outperforming Bitcoin over various timeframes.
One macroeconomic factor amplifying this trend is the growth in the U.S. M2 money supply. Increased liquidity tends to find its way into higher-risk assets, crypto being a prime candidate. In 2025, with inflation still a concern and equities showing mixed signals, altcoins are increasingly viewed as speculative growth vehicles.
If altcoin dominance continues breaking through key resistance levels, particularly if it rises above 25% without ETH dominance surging at the same pace, it could trigger widespread portfolio rebalancing into mid-cap tokens. Altcoin dominance doesn’t just complement BTC.D; it’s a powerful standalone signal that altcoins are claiming center stage.
The ETH/BTC chart compares the relative strength of Ethereum against Bitcoin. A rising ETH/BTC ratio typically signals that Ethereum is outperforming Bitcoin, which often serves as a precursor to a broader altcoin bull run. This ratio is especially useful because it reflects internal crypto market dynamics, free from fiat interference.
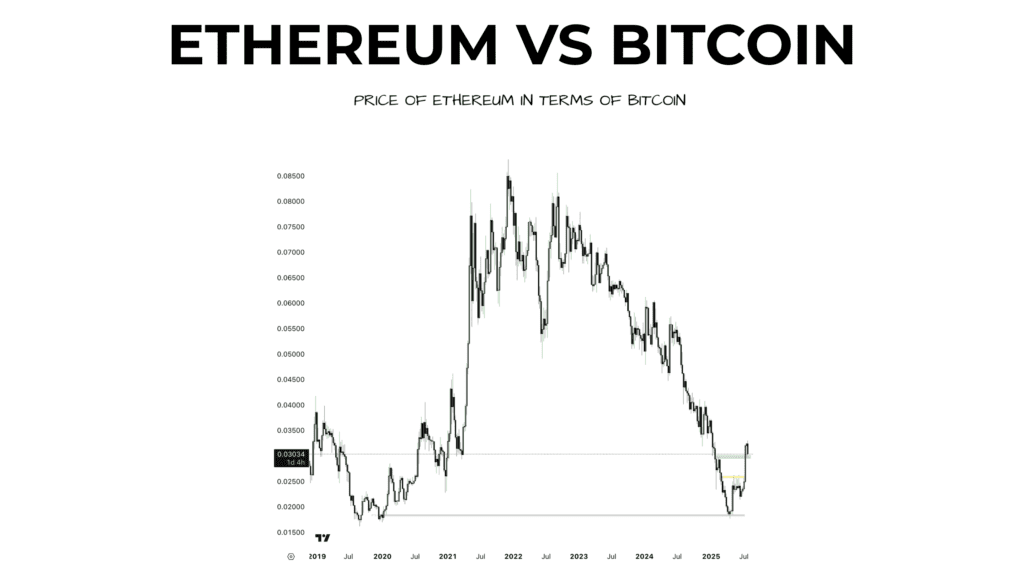
In 2025, this chart is showing strong signs of an upside breakout. After nearly a year of sideways consolidation, ETH is beginning to climb against BTC. Technical analysts are closely watching the 0.05 BTC level as a breakout threshold. A sustained move above this level would indicate Ethereum is gaining structural strength.
There are several catalysts driving this shift. Ethereum’s transition to a deflationary model post-EIP-1559 and its continued focus on ultrasound money have made ETH increasingly attractive relative to BTC. Unlike Bitcoin, Ethereum’s network continues to evolve rapidly, with rollups, restaking, and decentralized finance providing additional layers of value.
Moreover, the launch of ETH ETFs has further boosted Ethereum’s institutional credibility. Many analysts are projecting Ethereum to reach $5,000–$15,000 within this cycle, which could push the ETH/BTC ratio to levels not seen since 2017. When ETH begins to outperform Bitcoin, history shows that capital flows into altcoins tend to accelerate. This chart, then, is not just about ETH, it’s a directional beacon for the altcoin market at large.
Retail investor sentiment is a powerful force in crypto, often fueling the euphoric final leg of bull runs. One of the simplest ways to gauge this sentiment is by analyzing Google Trends data. Spikes in search queries like “altcoins,” “best crypto to buy,” or “buy Ethereum” are strong indicators of growing retail interest often a precursor to price surges. This is the best surface level tracker out of other complex Altseason indicators out there.
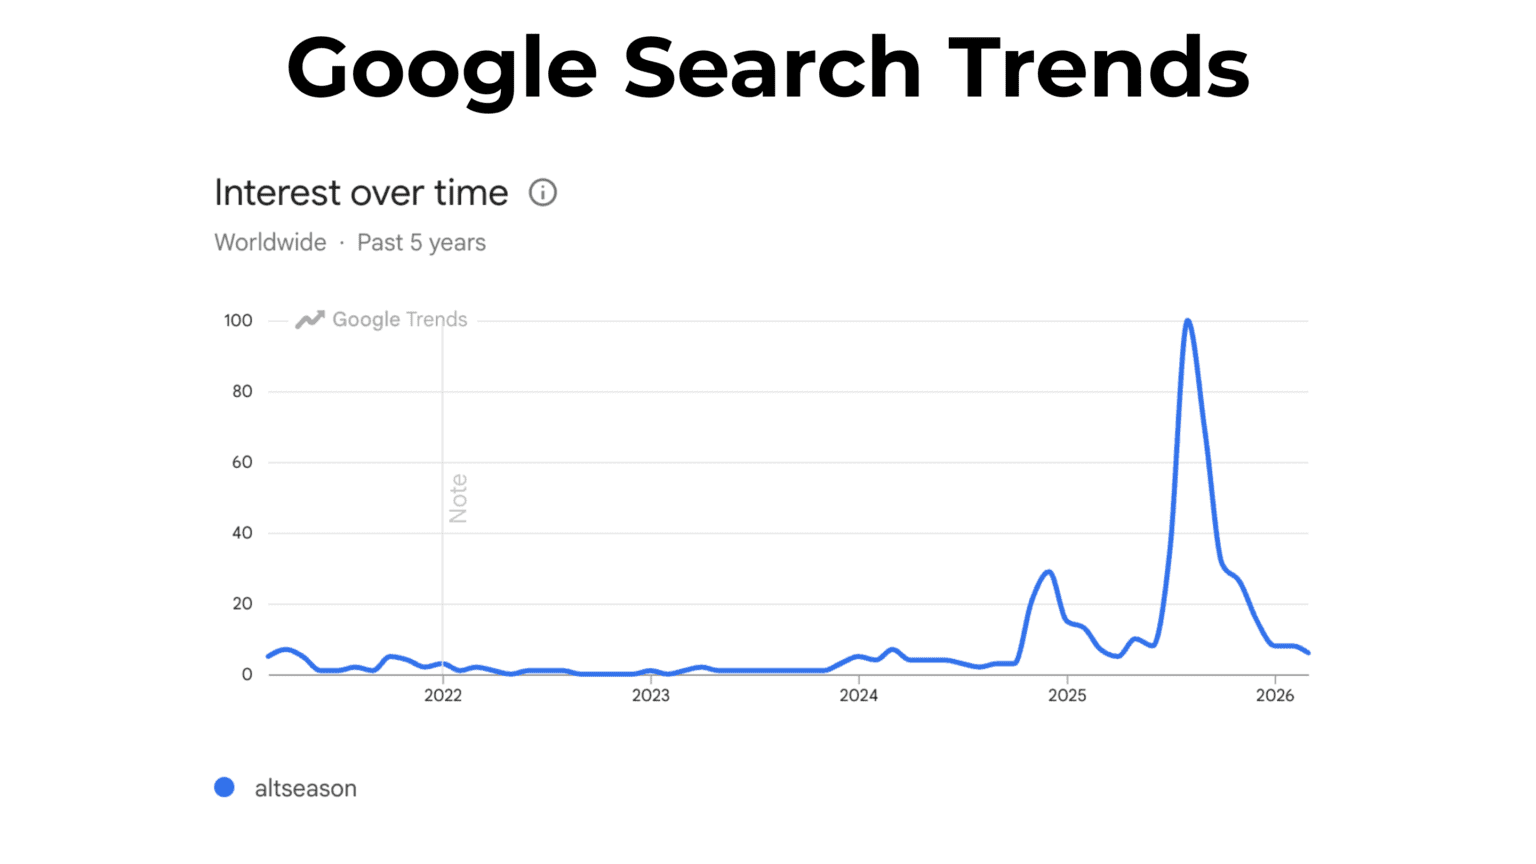
As of July 2025, Google Trends data shows altcoin-related searches hitting their highest level since 2021, with a score of 51 on the interest scale. While “buy Bitcoin” remains a dominant search term, queries related to altcoins are rapidly catching up, reflecting a diversification mindset among retail users.
This increase in search activity aligns with other Altseason indicators like declining BTC dominance and rising altcoin market share. Retail enthusiasm, once ignited, tends to amplify momentum, especially for lower-cap altcoins where liquidity is thinner and price reactions are more explosive.
Media coverage, social media hype, and influencer commentary often feed into these trends, creating a self-reinforcing loop. In 2025, with mainstream platforms giving more attention to the crypto market, these trends are becoming more volatile but also more predictive.
Tools like Google Trends, Nansen’s smart money dashboards, and Santiment can help traders identify when interest is peaking or just beginning to rise. When Google Trends data spikes across multiple altcoin-related terms, it’s usually the early stages of a larger retail-driven rally. In short: when the crowd shows up, the market moves and sometimes dramatically.
While on-chain metrics and dominance charts are critical, macroeconomic indicators often lay the foundation for major market cycles. In particular, the Federal Reserve’s monetary policy especially interest rates and quantitative easing (QE) has a significant impact on crypto performance.
In 2025, the Fed has held interest rates steady between 4.25% and 4.50%, but recent projections suggest at least two quarter-point cuts by year-end, with more expected in 2026. Although inflation remains a concern, the Fed appears poised to slowly shift toward a more accommodative stance.
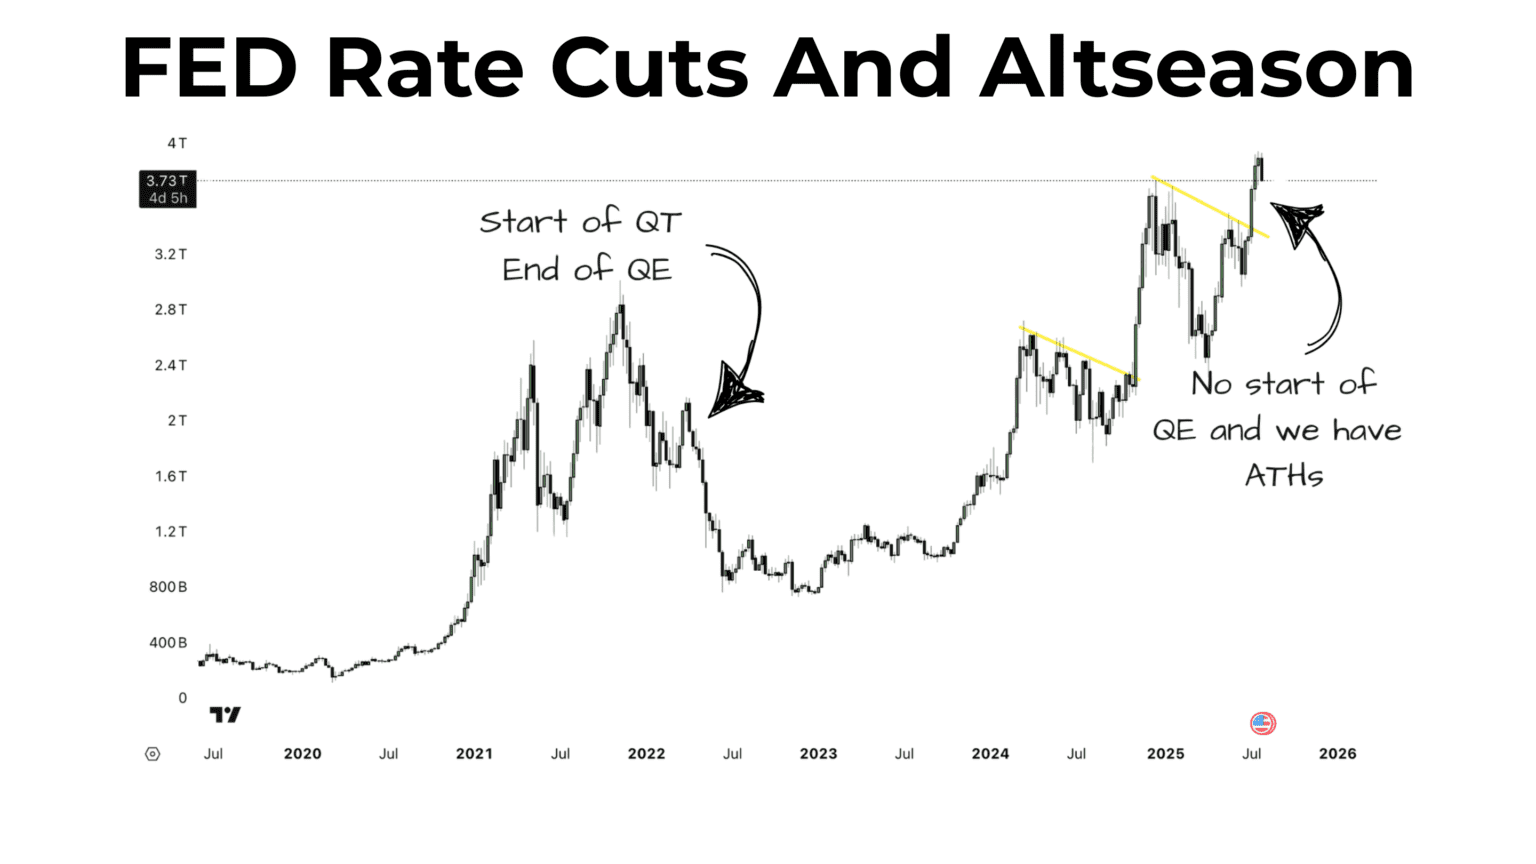
Why does this matter? Lower interest rates reduce the cost of borrowing, encourage capital to move out of savings and bonds, and increase the appeal of speculative assets like cryptocurrencies. Historically, every major Altseason has coincided with loose monetary policy, most notably in 2020–2021 when the Fed’s aggressive QE program flooded markets with liquidity. This is one of the strongest Altseason indicators on macro level
Even without full-blown QE, signals of easing are already influencing investor sentiment. Risk-on assets from tech stocks to altcoins are seeing renewed interest as the market anticipates lower yields and higher upside potential.
For crypto investors, watching Fed meeting minutes, rate projections, and bond yield movements is just as important as tracking Ethereum gas fees. If the Fed signals a full pivot or if inflation dips significantly, expect capital to rotate rapidly into higher-risk plays including small-cap altcoins, which thrive in high-liquidity environments.
The final and perhaps most potent, Altseason indicators in 2025 is the growing number of altcoin ETF filings and approvals. While Bitcoin and Ethereum ETFs have already opened the institutional floodgates, a second wave is building around next-tier tokens like Sui (SUI), Hedera (HBAR), Cardano (ADA), Ripple (XRP)
As of July 2025, the SEC has approved Bitwise’s (a crypto asset manager) multi-asset crypto index ETF, which includes XRP, signaling a willingness to expand access beyond BTC and ETH. CoinShares (a digital asset investment firm) also filed for a spot XRP ETF back in January, and analysts believe that SOL, ADA, and DOGE could receive approval before the end of the year.
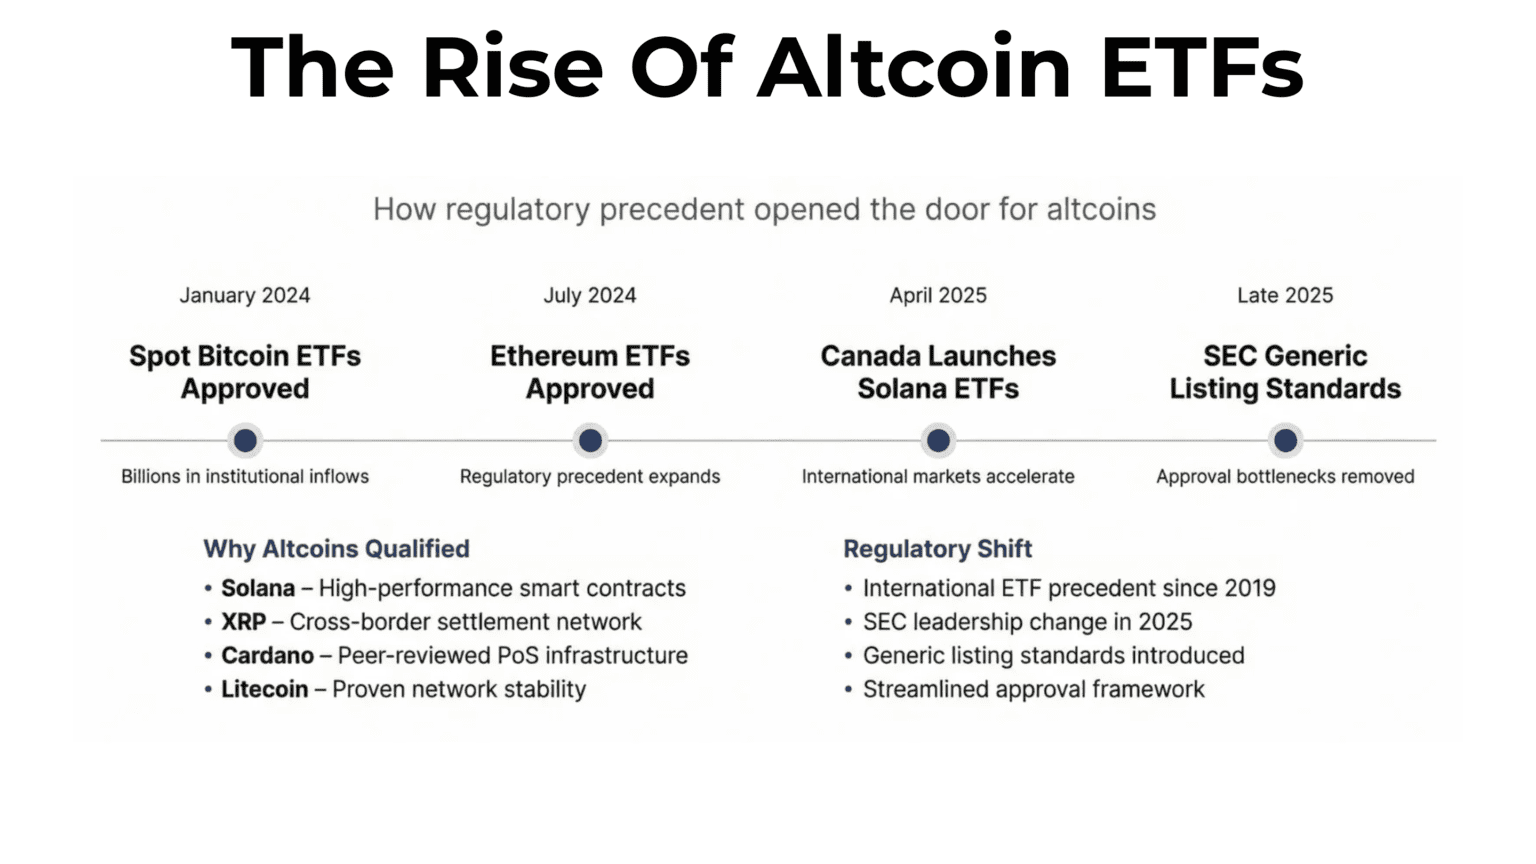
If these ETFs gain traction the way Ethereum’s have, they could trigger the next major altcoin wave. Institutional validation creates long-term demand and reduces volatility, both crucial ingredients for a sustained Altseason.
In the context of 2025, ETF filings are not just regulatory headlines, they are structural catalysts that could redefine how altcoins are valued and traded in traditional markets.
No single indicator confirms altseason. The strongest signal comes from convergence, when multiple indicators align at the same time.
A practical framework:
Early signals (2–3 indicators):
Bitcoin dominance declining + ETH/BTC rising + ETF inflows increasing. This suggests early capital rotation.
Confirmation (4–5 indicators):
Add rising altcoin dominance and surging Google Trends. This indicates both institutional and retail participation.
Full altseason (6–7 indicators):
Fed rate cuts + altcoin ETF approvals create strong liquidity and demand. At this stage, altseason is fully underway.
Tracking these indicators weekly is key. Short-term spikes can be misleading, but sustained alignment over 2–3 weeks is a strong confirmation signal.
How key altseason indicators currently compare with typical breakout thresholds
The crypto market in 2025 is teetering on the edge of transformation. While Bitcoin’s ascent has drawn headlines, the real action may soon shift toward altcoins and these seven Altseason indicators are your roadmap.
Each signal on its own offers value. But when they converge, the result is often a full-fledged Altseason, where even mid- and small-cap coins post triple-digit gains. We’re already seeing multiple indicators flash green: ETH inflows are strong, dominance charts are shifting, retail search activity is accelerating, and macroeconomic conditions are increasingly favorable.
Yet, this isn’t about chasing hype. It’s about understanding the structural dynamics behind capital rotation, sentiment shifts, and institutional adoption. Altseasons reward those who prepare not those who react too late.
This article is updated monthly through December 2025 based on ETF inflows, Bitcoin dominance, and macroeconomic data. After Altseason either confirms or doesn’t, a retrospective “What Actually Happened” section will be added to convert this predictive guide into an analytical resource, extending its evergreen value.