Rave DAO's $RAVE token surged 3,800% in under two weeks. Full breakdown of what happened, the red flags, and risks ahead.
Author: Tanishq Bodh
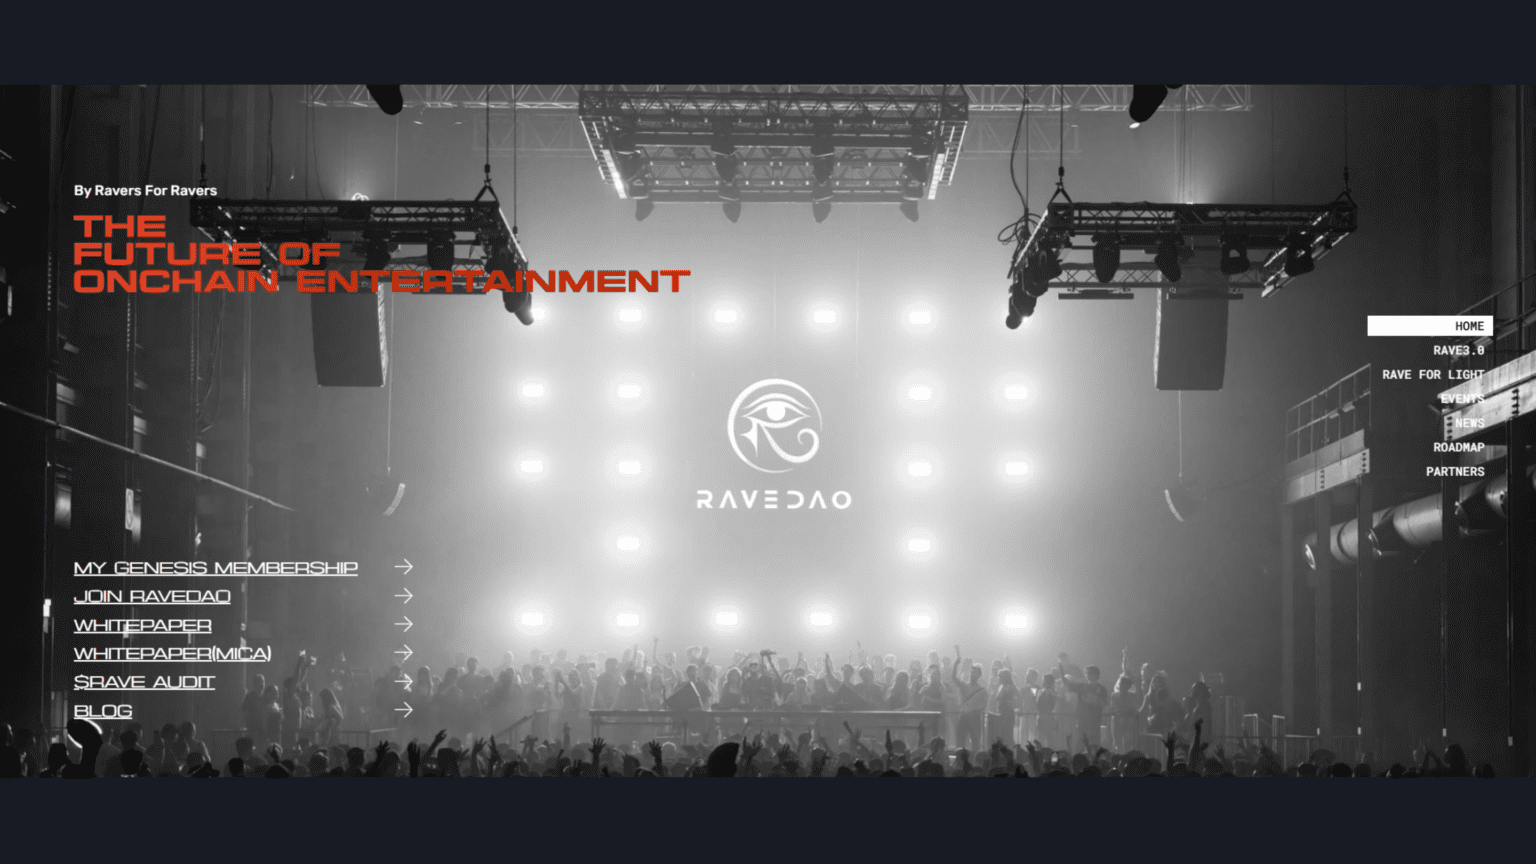
RaveDAO is a decentralized autonomous organization built around live electronic music events. Think of it as a global rave collective running on blockchain rails, where the community votes on everything from event locations and artist lineups to philanthropic allocations.

The origin story starts small. A 200-person crypto afterparty at Devcon Istanbul in late 2023. From there, the project scaled across Singapore, Amsterdam, Dubai, Bangkok, and Miami, eventually crossing 100,000 total attendees and securing partnerships with 1001Tracklists, AMF, and Warner Music. A Lisbon Dance Summit co-hosting slot is scheduled for late April 2026.
The revenue model is worth noting because it sets RaveDAO apart from most tokens that run purely on speculation. The project claims verified event revenue of ~$1.3 million in 2024, with projections of roughly $7 million for 2026. A portion of that revenue funds quarterly token buybacks and burns. The “Rave for Light” philanthropic arm has funded 400+ cataract surgeries in Nepal and over 150 meditation programs in the U.S.

On the product side, $RAVE functions as the coordination layer for the ecosystem. B2B utilities include stake-to-license IP, chapter activation via DAO grants, and vendor qualification staking. B2C utilities cover VIP access, early entry, NFT drops, on-site crypto payments, and community rewards. Governance lets holders vote on event decisions and ecosystem grants.
The token launched on Base and uses the x402 payment standard, aiming to make festival payments in stablecoins feel seamless. Exchange support includes Bitget, Gate, Hotcoin, and PancakeSwap, with Binance Alpha tagging and broader CEX listing momentum through early 2026.
Before the price action makes any sense, the token structure needs context. This is where the story really starts.
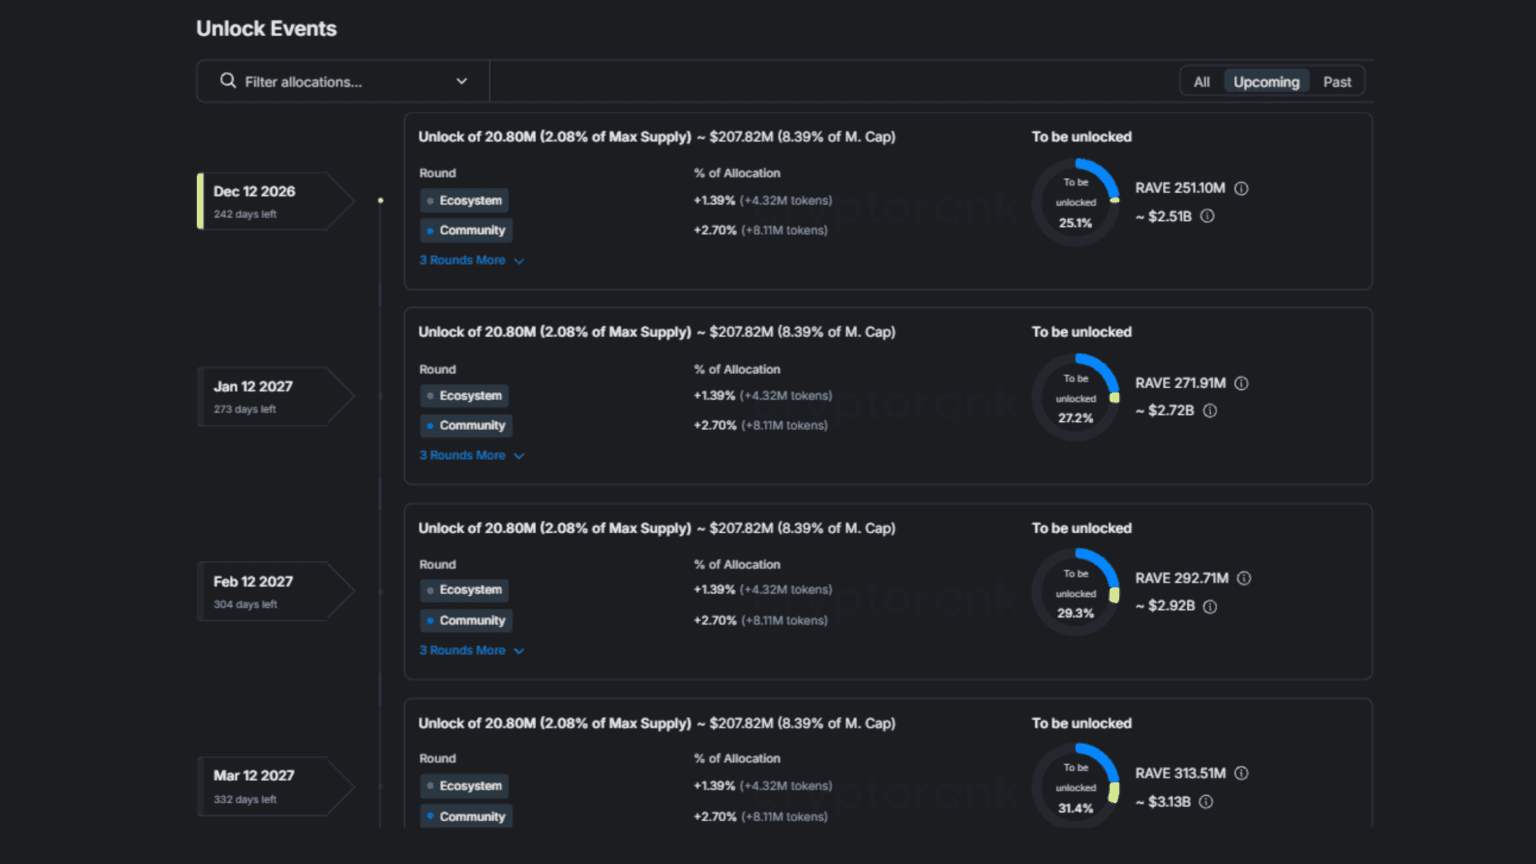
Total and maximum supply sits at 1 billion RAVE. Circulating supply at the time of the surge was roughly 248 million tokens, which represents only about 24-25% of total supply. The remaining ~76% is locked across team allocations, ecosystem funds, and vesting schedules with typical 12-36 month cliffs and linear unlock periods.
This low-float structure is the single most important factor in understanding what happened in April 2026. With only a quarter of supply trading freely, every buy order hits harder. Every withdrawal from an exchange tightens available liquidity further. And every short position becomes exponentially more dangerous because the float to cover against keeps shrinking.
The fully diluted valuation (FDV) during the surge ran at 4x or higher than the circulating market cap, creating a significant dilution overhang. In plain terms, if the locked tokens ever hit the open market at scale, the current price has very little structural support.
Here is the day-by-day breakdown of what actually happened.
Data sourced from CoinMarketCap historical daily closes (UTC). April 13 reflects the live/current price at time of writing. Prices are approximate closes and the token was extremely volatile with large intraday swings. The all-time high hit ~$10.22 on April 13.
RAVE traded in a tight range between $0.24 and $0.26 for most of early April. Nothing unusual. Volume was low, in the tens of millions. The token had been recovering from an all-time low of $0.1428 in December 2025, but the pace was unremarkable. Most traders were not paying attention.
April 7-8 showed the first signs of life with a modest move to $0.31, up ~23% from the April 3 baseline. This could have easily been organic accumulation or early positioning. It did not register as unusual on any major radar.
April 9 changed everything. $RAVE jumped from $0.31 to nearly $1.00 in a single day, a 215% move. Trading volume surged from low tens of millions to $270 million, a figure that nearly matched the token’s entire market cap at the time. No new partnership was announced, protocol upgrade shipped. No major media coverage preceded the move.
April 10 continued the momentum. The price pushed to $1.61 with daily volume remaining elevated. By this point, social mentions of $RAVE on X and Telegram had exploded more than 5x compared to the previous week. The token entered the top 250 by market cap.
This is where the first major red flags emerged publicly. Crypto analyst Sumit Kapoor posted on X that two wallets linked to the token’s deployment address had transferred 18.58 million RAVE to Bitget just as the price started spiking. He noted the move effectively turned an $8 million position into roughly $19 million, suggesting insider positioning ahead of a potential sell-off.
The rally did not care about the red flags. April 11 added another 34.7%, pushing $RAVE past $2.16 on April 12 delivered the most violent single-day move of the entire saga at +190.5%, catapulting the price to $6.30., April 13 saw the all-time high of $10.22 with 24-hour volume exceeding $737 million.
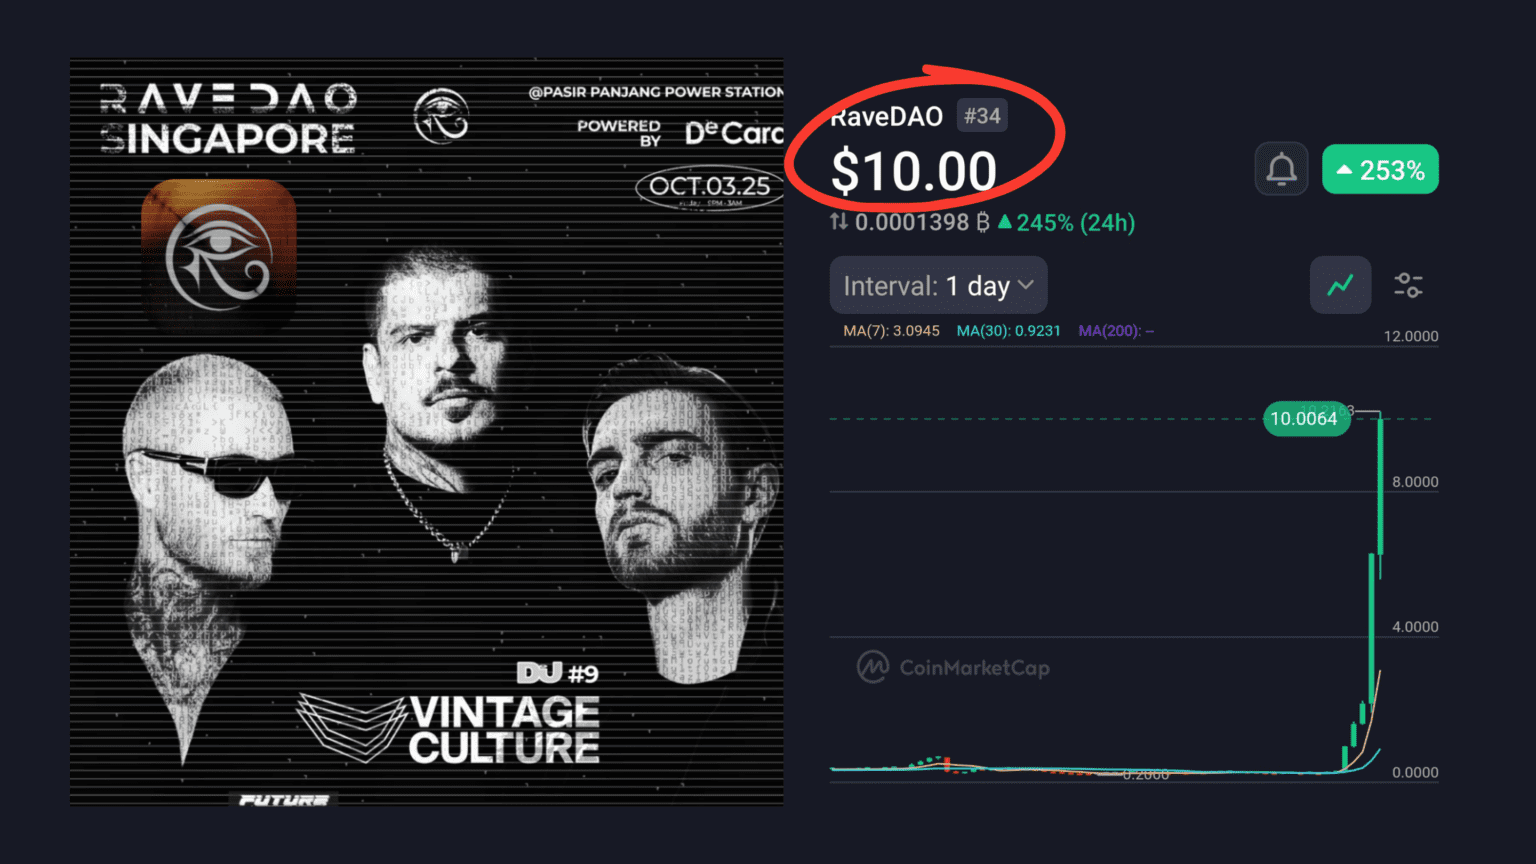
Market cap jumped from low hundreds of millions to approximately $2.5 billion on a circulating basis. The fully diluted valuation approached $10 billion at the peak. $RAVE climbed to the #34 spot on CoinMarketCap.
A $0.25 token turned into a $10 token in under 10 days. Over 3,800% cumulative gains from the April 3 baseline.
Spot buying alone did not produce this move. The derivatives market played a central and arguably dominant role.
Futures open interest surged over 400% during the rally, reaching approximately $250 million in some reports. Futures trading volume dwarfed spot volume by as much as 23x. Funding rates hit extreme levels. Short liquidations exceeded $100-134 million, with Binance futures taking the heaviest hit.
The mechanics are straightforward. As the price started moving up, short sellers got squeezed. Forced liquidations created additional buy pressure. That buy pressure pushed the price higher, which liquidated more shorts, which created more buy pressure. This feedback loop, running on a low-float token with only 24% circulating supply, produced the parabolic chart.
Analysts noted that this pattern, where futures volume overwhelmingly exceeds spot and open interest surges simultaneously, has historically been associated with either genuinely explosive breakouts or coordinated manipulation. Distinguishing between the two in real-time is nearly impossible.
Multiple on-chain data points raised serious concerns. These were widely reported across crypto news outlets including AInvest, MEXC, CaptainAltcoin, CoinAlert, and Cryptopolitan.
Two wallets linked to insiders or the project deployer deposited 18.58 million RAVE (~$8M at pre-pump prices) onto Bitget approximately 48 hours before the major breakout. No public disclosure accompanied these transfers. As the price surged, that $8M position ballooned to roughly $19M or more.
There was a broader pattern that some analysts described as a “confusion tactic.” One address moved ~30.58 million RAVE into Bitget, which would normally signal incoming sell pressure. But then ~31.94 million RAVE was withdrawn on-chain, effectively tightening exchange liquidity and trapping short sellers who expected a dump.
Near the peaks, deployer-linked wallets transferred approximately 20 million RAVE total (in two ~10M batches) to exchanges. This was interpreted by multiple analysts as distribution, meaning insiders selling into retail FOMO at elevated prices.
The low float is not accidental. With only ~25% of supply circulating, coordinated withdrawals from exchanges can create outsized price impact with relatively small capital. Analysts noted that gains were unusually uniform across 40+ fiat and trading pairs, which is more consistent with coordination than with organic demand that typically shows spreads and arbitrage gaps between pairs.
Volume-to-market-cap ratios ranged from 28% to over 80% during the surge. While breakout tokens can see elevated ratios, levels consistently above 50-60% are historically associated with wash trading or artificial volume inflation. The 1,300% volume spike on April 10, where trading volume nearly matched the entire market cap, is an extreme outlier by any standard.
Perhaps the most telling signal is what did not happen. There was no major announcement, no new exchange listing during the pump itself, no protocol upgrade, no celebrity endorsement, no viral social media moment. The rally ignited from a quiet base with minimal preceding hype. Projects that move 3,800% in a week on pure organic demand almost always have a clear “before and after” catalyst. $RAVE did not.
Not everyone is calling this a pump. Some analyses point to legitimate factors that could support the move, even if they do not fully explain the magnitude.
Rave DAO has a genuine narrative. Web3 music events, NFT ticketing, real venue bookings, verifiable revenue, and partnerships with recognized names like Warner Music, AMF, and 1001Tracklists are not fabricated. The project generated real revenue in 2024 and has a pipeline of events including a sold-out “Dim Sum Rave” in Hong Kong (April 18) and the Lisbon Dance Summit (April 29). This is more substance than the vast majority of tokens that see parabolic runs.
Whale accumulation and institutional-style flows on tier-1 exchanges were visible in on-chain data. Some analysts argued the volume ratios, while elevated, sat in a “sustainable but elevated” zone for breakout tokens rather than definitively in pump territory.
The short squeeze itself is a legitimate market mechanic. Overleveraged short sellers getting wiped out is not manipulation in isolation. It happens when the market structure is skewed and a catalyst (or even random buying) triggers the cascade.
A broader risk-on sentiment across crypto markets in early April, partially attributed to geopolitical developments, may have provided a macro tailwind that helped altcoins including $RAVE.
Regardless of whether the surge was organic, coordinated, or some mix of both, the risk profile at current levels is extreme.
The RSI hit 88-96 during the rally, deep into overbought territory. Historically, tokens that reach these levels after parabolic runs see sharp corrections of 50-70% as a baseline, with analogous low-float cases experiencing 70-95% drawdowns.
The vesting and unlock schedule is the structural risk that matters most. With 76% of supply still locked, the coming months will bring token releases into the market. If demand does not absorb those unlocks, the sell pressure could be significant. The FDV-to-circulating-cap gap (roughly 4x during the surge) quantifies this overhang.
Concentration risk is high. A small number of wallets hold outsized portions of the circulating supply. Any large holder deciding to take profit can move the price meaningfully.
The derivatives positioning that fueled the rally can reverse just as violently. If long positions get overleveraged and the price dips, the same liquidation cascade that pushed the price up can pull it down.
No confirmed rug pull or treasury theft has been reported. This is not a scam in the traditional sense. But the line between momentum trading and market manipulation is thin, and the wallet activity raises questions that the project has not publicly addressed.
For anyone following this story, four things matter in the near term. First, exchange flow data for deployer and insider-linked wallets. Large deposits to CEXs signal potential selling. Second, the derivatives positioning, specifically open interest trends, funding rates, and the long/short ratio. Third, any official statement from the RaveDAO team addressing the wallet activity flagged by on-chain analysts. Fourth, how the token price behaves around the upcoming real-world events (Hong Kong on April 18, Lisbon on April 29), since “sell the news” reactions are common after parabolic runs into known catalysts.
The official channels are @RaveDAO on X and ravedao.com.
RaveDAO is one of those rare crypto stories where the underlying project has genuine merit. Real events, revenue , real partnerships and real philanthropic output. That is more than most tokens in the top 100 can claim.
But a project being real does not make a 3,800% rally in 10 days rational. The tokenomics were designed for sensitivity. The derivatives market was positioned for a squeeze. The wallet activity before and during the surge is, at minimum, concerning and, at worst, textbook pre-pump positioning.
None of this is financial advice. This is a high-risk, high-volatility asset where prices can swing 50%+ in hours. Always cross-check live data on CoinGecko or CoinMarketCap, verify on-chain flows through blockchain explorers, and factor in the unlock schedule before making any decisions.
The music may be real. The question is whether the price is dancing to the same beat.