Discover the 10 best Dune Analytics dashboards in 2026 for tracking DeFi, Bitcoin ETFs, prediction markets, x402, Lighter, & on-chain trends.
Author: Akshat Thakur
Dune Analytics has become one of the most essential tools in Web3, and in 2026, the need for structured and transparent blockchain data has never been greater. Whether you’re a trader, researcher, or protocol founder, understanding the best dune analytics dashboards 2026 can dramatically improve how you navigate the crypto ecosystem.
As Web3 accelerates with new Bitcoin ETF flows, high-volume Layer-2 networks, and AI-integrated trading models, the ability to separate real on-chain activity from hype becomes a crucial competitive advantage. These Top 10 Dune Analytics dashboards bring clarity to an ecosystem flooded with narratives, giving users verified data insights into trading, liquidity, token sales, prediction markets, and economic trends shaping 2026.
By transforming raw blockchain data into readable dashboards, Dune empowers users to verify claims, uncover real activity, monitor network health, and identify early signals long before the market reacts. With over a million active users and billions of cumulative queries, Dune has become the public data layer of Web3 democratizing analytics that were once accessible only to venture funds and institutional research desks.
Last updated: April 2026
Dune Analytics is one of the most widely used tools for exploring blockchain data. It lets users query onchain activity using SQL, powered by DuneSQL, which is built on the Trino framework. In simple terms, it turns raw blockchain data into something you can actually read and analyze.
A Dune dashboard builds on top of that. Instead of just running queries, users can convert results into charts, tables, and graphs. These dashboards present real-time insights across metrics like token flows, liquidity, user activity, and market trends. You are not digging through transactions. You are looking at structured, visual data.
The platform supports over 130 blockchains and processes massive datasets across ecosystems. It also includes a Data Catalog, which helps users understand available tables and schemas without needing deep technical knowledge.
If you are going through a dune analytics tutorial 2026, dashboards are where things start to click. They let you track narratives, monitor protocols, and share insights with others in a clean format. For analysts, traders, and builders, Dune dashboards are less about raw data and more about extracting clear signals from it.
Dune Analytics has established itself as the backbone of open, transparent blockchain intelligence. By enabling anyone regardless of background to query data using SQL and build dashboards that visualize network activity, Dune has turned Web3 into a collaborative analytics playground. In a world where centralized datasets often obscure methodology or hide inconvenient truths, Dune’s fully open data pipelines allow anyone to audit the auditors.
Dashboards built on Dune empower users to validate protocol claims, track token emissions, follow wallet activity, and monitor ecosystem health in real time. This fosters a culture of accountability across Web3, where success must be backed by measurable on-chain evidence rather than marketing slides or inflated vanity metrics.
As crypto becomes more modular, multi-chain, and interconnected, Dune’s multi-chain support helps users follow liquidity, user flows, and developer activity across ecosystems giving a complete picture rather than chain-specific silos. The platform has evolved into a living research environment used by traders, researchers, institutions, DAOs, and regulators alike.
The volatility of 2026 has taught the industry an important lesson: social media sentiment is unreliable, influencer commentary is biased, and off-chain data can be manipulated. On-chain data, however, is immutable and verifiable. It provides a real-time pulse of user behavior, capital flows, and protocol performance without distortion.
With DeFi maturing, prediction markets gaining mainstream influence, and token sales attracting global participation, analyzing metrics like wallet distribution, liquidity depth, and fee revenue is essential for detecting organic adoption versus artificial activity. On-chain data also exposes risks from whale accumulation patterns to suspicious fund movements allowing users to anticipate problems before they become headlines.
As institutional adoption grows through Bitcoin ETFs, staking products, and tokenized funds, transparency becomes the foundation of trust. On-chain analytics ensure that users are not operating in the dark as billions of dollars move across protocols each day.
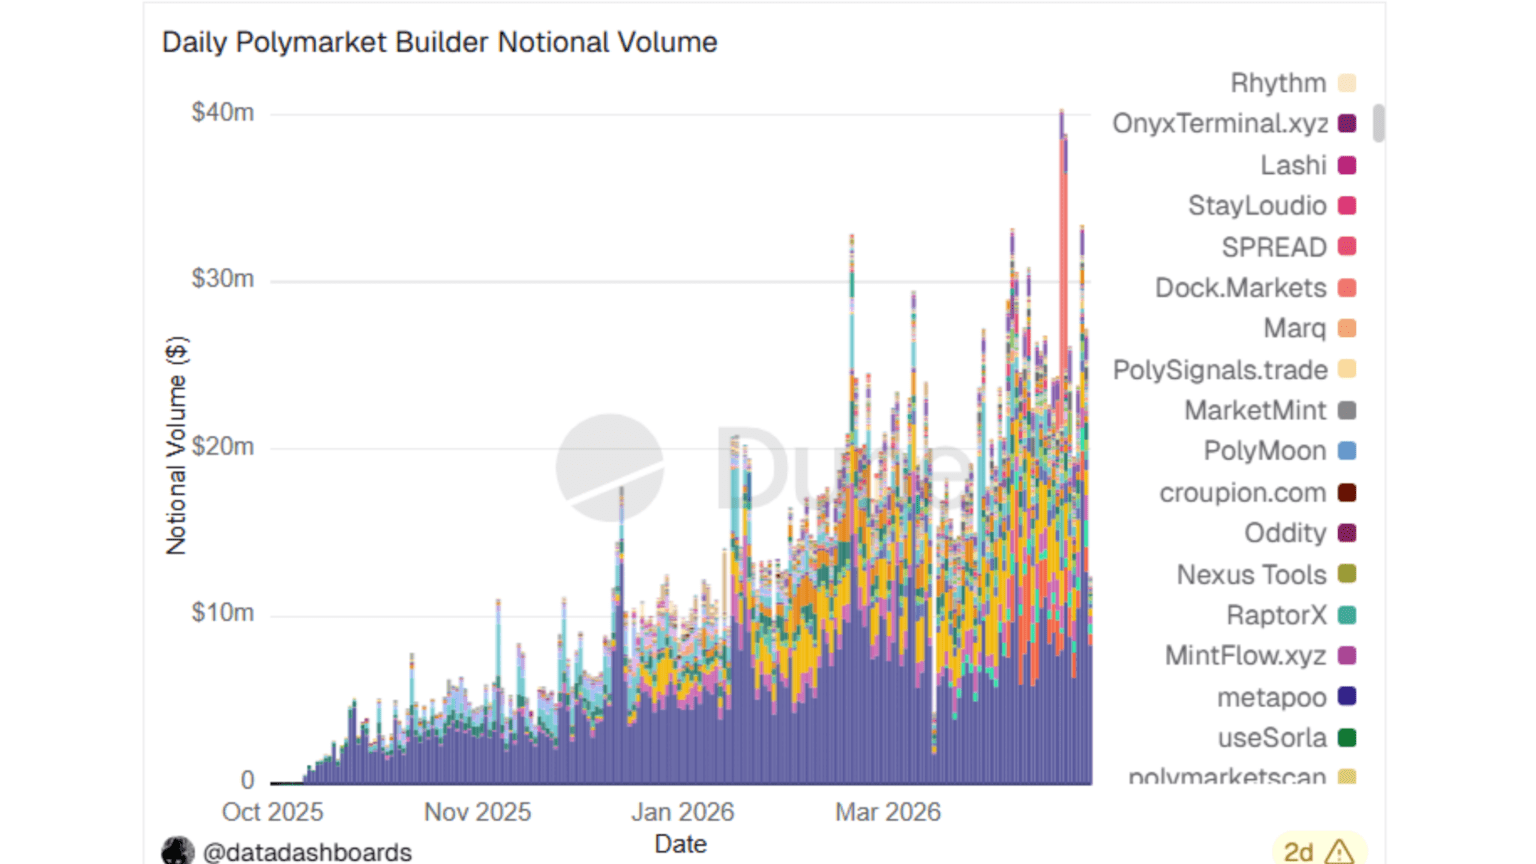
Polymarket’s explosive growth as the leading Web3 prediction market is powered largely by its ecosystem of builders, individuals who create and manage markets tied to real-world events. This dashboard reveals how builders attract traders, generate volume, and shape market dynamics behind the scenes.
Key Features
This dashboard is essential for anyone studying prediction markets because it exposes the mechanics of builder-driven engagement. High-performing builders often align their markets with political cycles, sports events, and global news, creating natural liquidity spikes. Tracking trader growth and volume helps users anticipate which markets may surge next. For researchers and investors, this is an invaluable lens into Polymarket’s decentralized growth engine.
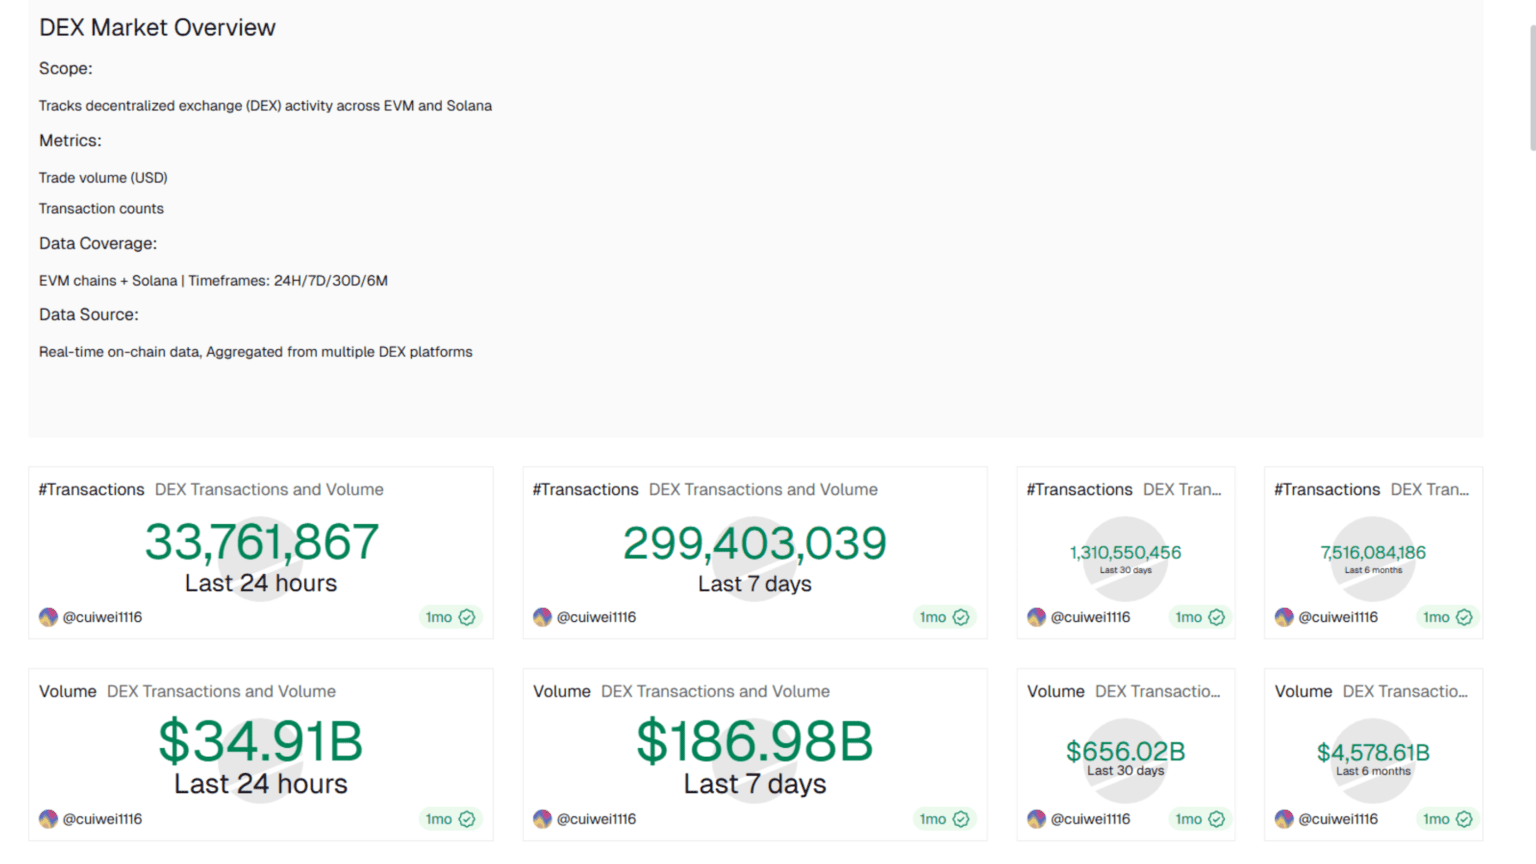
The DEX Metrics Dashboard aggregates trading activity across leading decentralized exchanges, offering a unified view of liquidity, fees, and user engagement in DeFi. As DEXs compete across Ethereum, Solana, Base, and other chains, understanding where real trading happens is critical.
Key Features
This dashboard shows where liquidity is deepest, which chains dominate volume, and how narratives like L2 growth or fee reductions impact trading behavior. Traders can use it to identify inflows, rotation trends, or upcoming volatility. For protocols, it highlights whether incentives or partnerships are actually driving traction. In a fragmented multi-chain world, this dashboard acts as a compass for navigating DeFi liquidity.
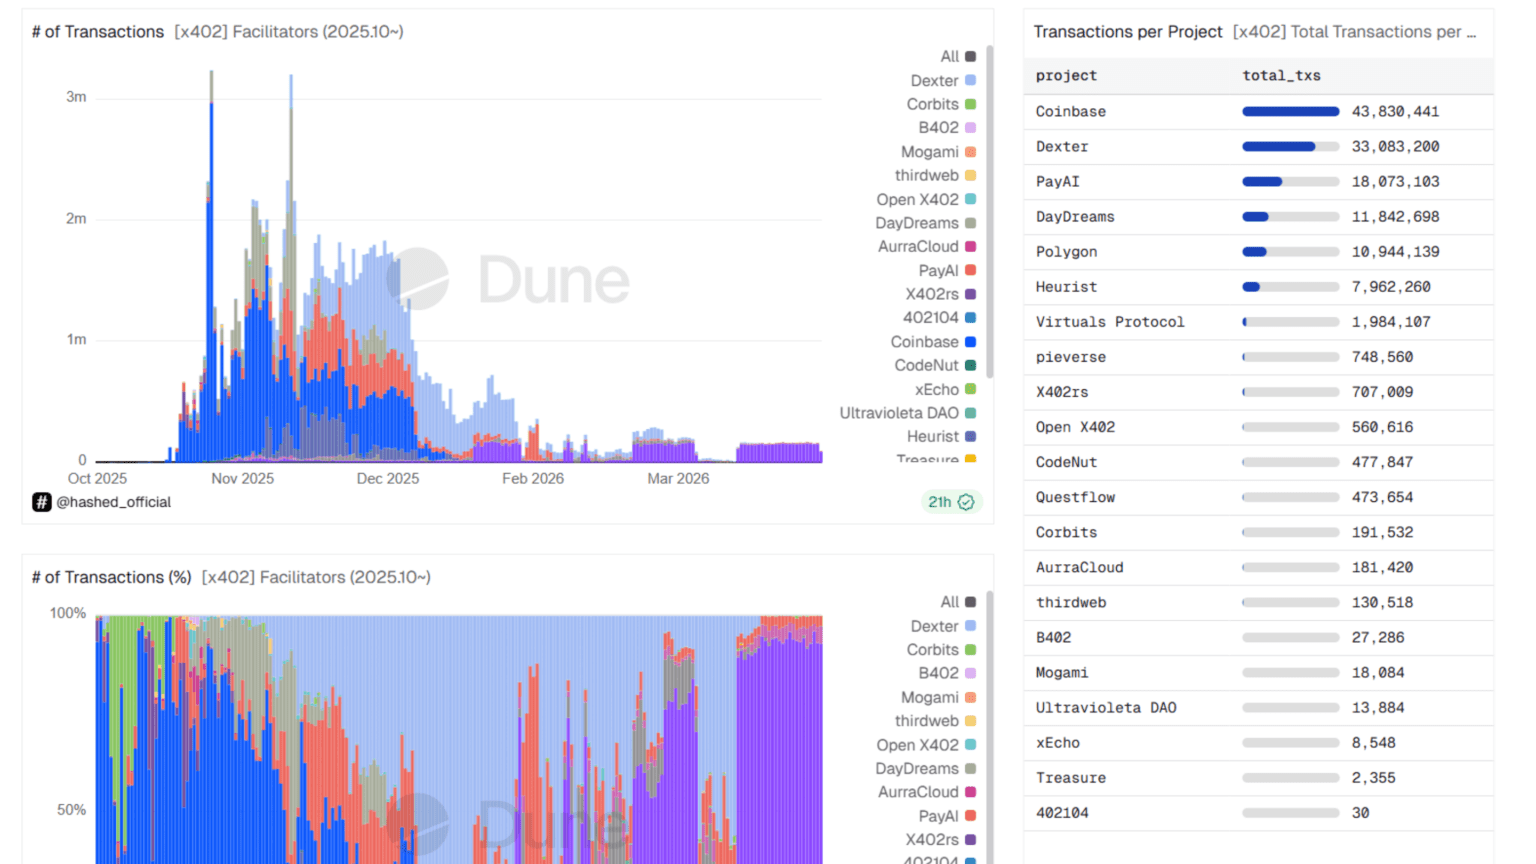
x402 monitors facilitator-driven transactions the intermediaries powering many Web3 operations behind the scenes. These entities streamline bridging, routing, and complex multi-step interactions across ecosystems.
Key Features
This dashboard helps users understand which facilitators are trusted, which chains they prefer, and how traffic flows through the Web3 backend. High facilitator activity often signals rising adoption of cross-chain or automation tools. For protocols, this visibility helps validate partnerships or detect bottlenecks. For investors, facilitator dominance can reveal where value will concentrate as the modular blockchain stack expands.
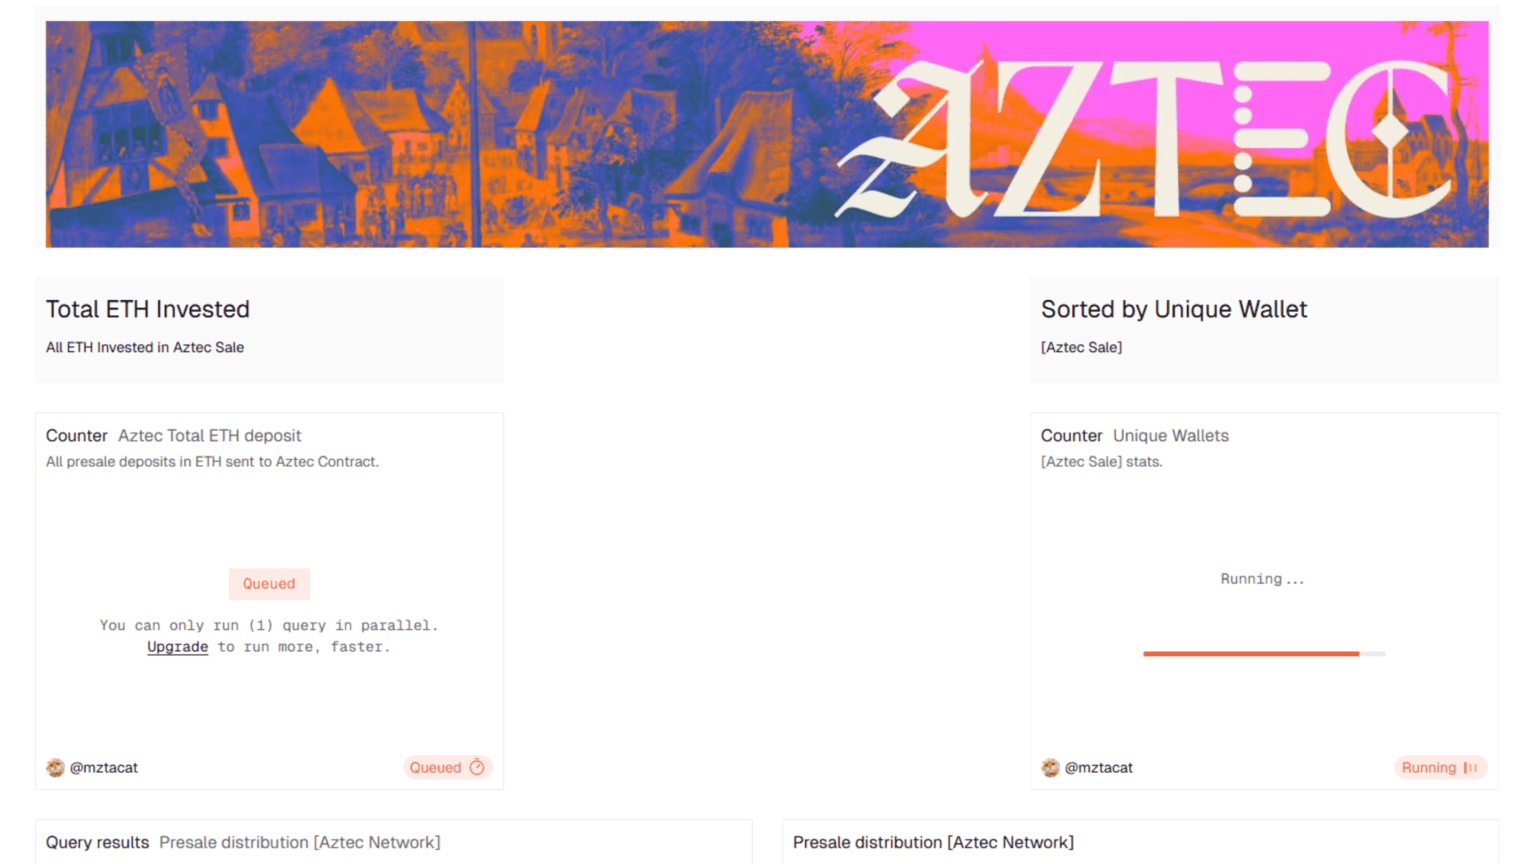
Aztec’s Genesis Sale was one of Web3’s most anticipated token events, centered around privacy-focused L2 technology. This dashboard tracks participation metrics, financial contributions, and wallet distribution offering unparalleled transparency.
Key Features
This dashboard helps users evaluate fairness, decentralization, and long-term holding potential. A wide spread of deposits signals genuine community demand, while concentrated whale tiers may indicate post-launch volatility risks. As privacy technology gains momentum, understanding contribution patterns helps forecast adoption trends and initial market behavior.
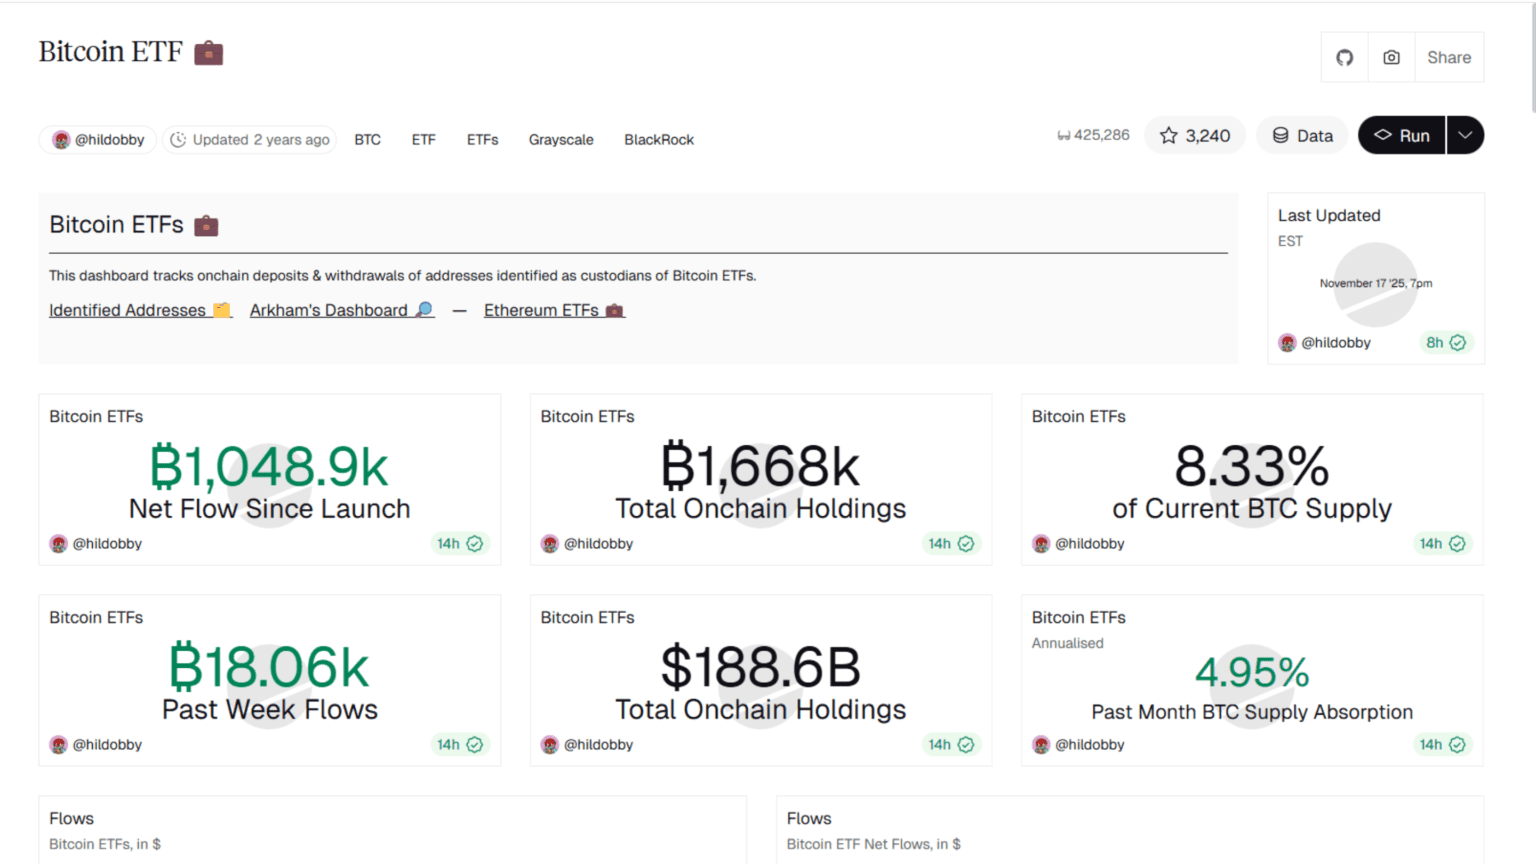
The Bitcoin ETF Dashboard is perhaps the most impactful for macro-level analysis, tracking institutional Bitcoin accumulation across major ETF issuers like BlackRock, Fidelity, and ARK.
Key Features
This dashboard is essential for anyone analyzing Bitcoin’s supply dynamics. Large ETF inflows reduce circulating supply, contributing to structural price pressure. AUM growth reveals institutional appetite, while supply absorption metrics show how ETFs reshape Bitcoin’s liquidity landscape. As traditional finance and crypto converge, this dashboard stands at the center of macro crypto analysis.
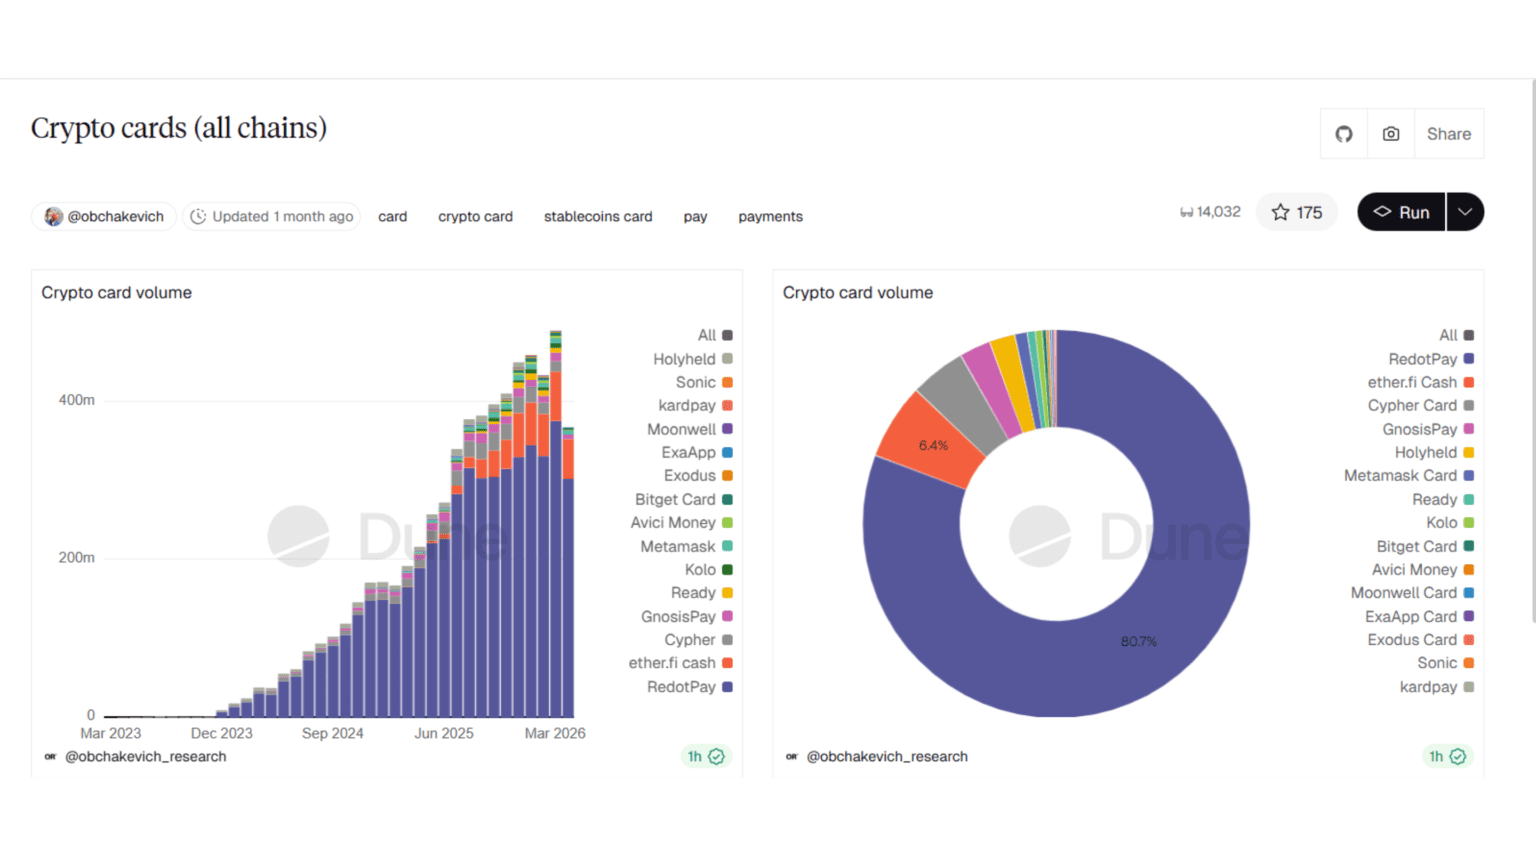
Crypto-linked debit and credit cards have become one of the strongest bridges between blockchain and traditional commerce. This dashboard tracks spending behavior across all major chains.
Key Features
The dashboard offers valuable insights into real-world crypto adoption, especially as stablecoins become mainstream payment tools. Rising card volume often signals increasing user trust, expanding merchant support, and a shift toward everyday blockchain utility. It’s a forward indicator of mass adoption one of the industry’s biggest milestones.
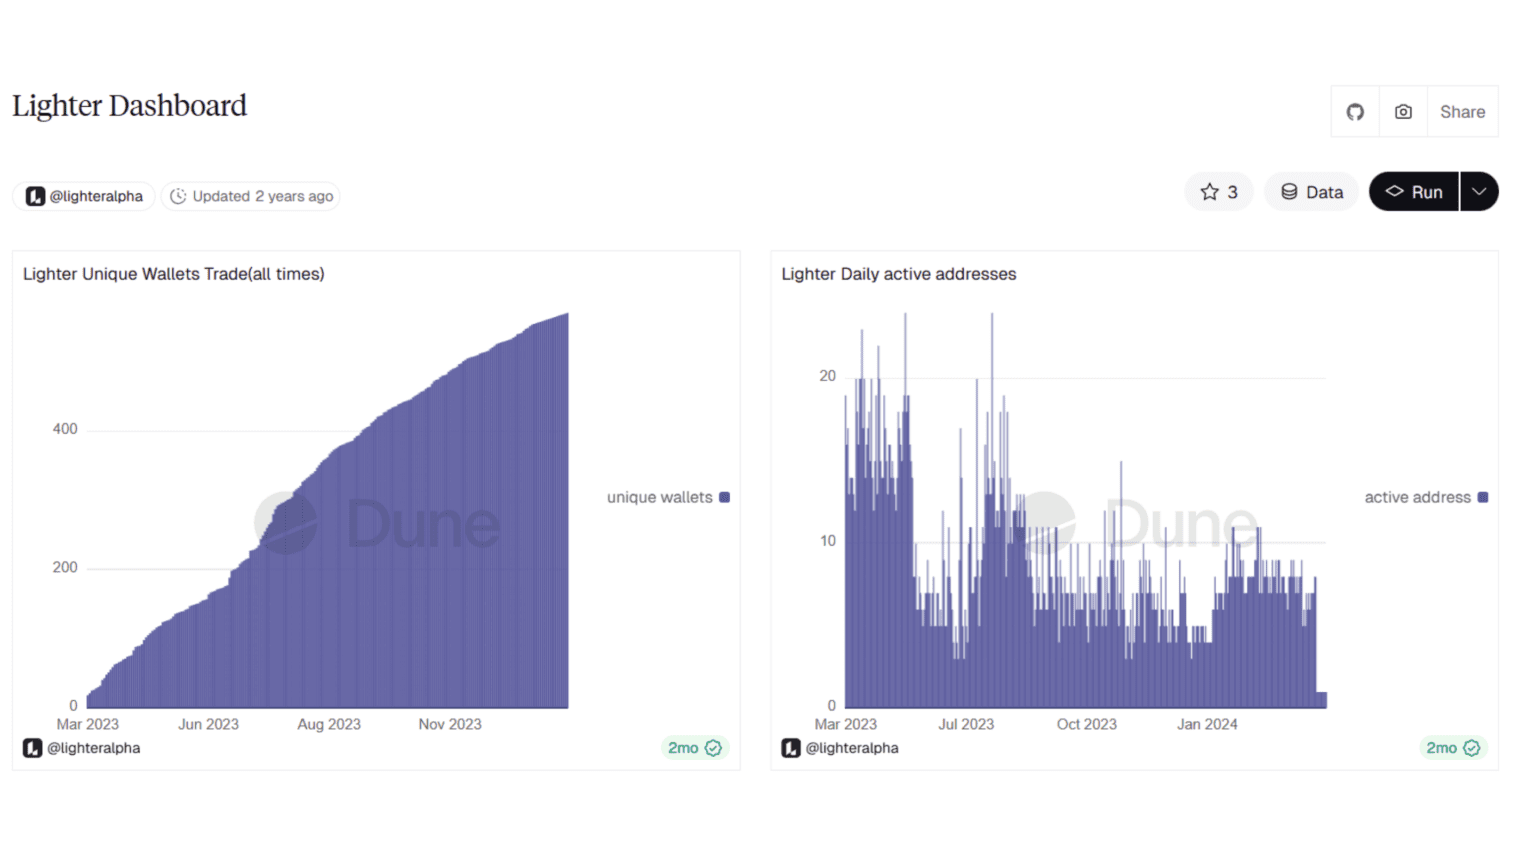
The lighter protocol dune dashboard has become a go-to resource for tracking one of the fastest-growing perpetual trading ecosystems on Ethereum L2. The Lighter protocol focuses on high-speed derivatives trading, and this lighter dune dashboard surfaces key insights around trader behavior, liquidity distribution, and capital efficiency.
It highlights user deposit tiers, including segmentation of wallets that have never withdrawn. This gives a clear signal of sticky liquidity. Daily trading volume and total value locked help track growth, while PNL and points data reveal how incentives are shaping trader behavior. With coverage across 100+ markets, it also shows where activity is concentrating.
This section focuses on the core indicators that define the health of the Lighter protocol. Active users are tracked across daily and longer timeframes, helping separate real growth from short-term spikes. Open interest provides a view into how much capital is actively deployed in positions, along with potential risk zones tied to leverage.
Volume adds another layer. It shows how much trading activity is flowing through the protocol and how it evolves over time. When active users, open interest, and volume rise together, it signals strong participation and conviction. When they diverge, it often points to weakening momentum or short-term speculation.
The Lighter DEX dashboard expands the analysis beyond isolated metrics. It compares on-chain activity with centralized exchanges, giving context to where liquidity is moving. This on-chain vs CEX comparison helps identify whether traders prefer decentralized execution or are shifting back to centralized venues.
Deposit tiers are broken down into clear segments, showing how capital is distributed across retail and larger players. Combined with wallet retention data, this reveals how committed users are to the platform.
For traders and analysts, the lighter protocol dune dashboard turns raw data into a clear view of market structure, positioning, and competitive standing in the derivatives space.
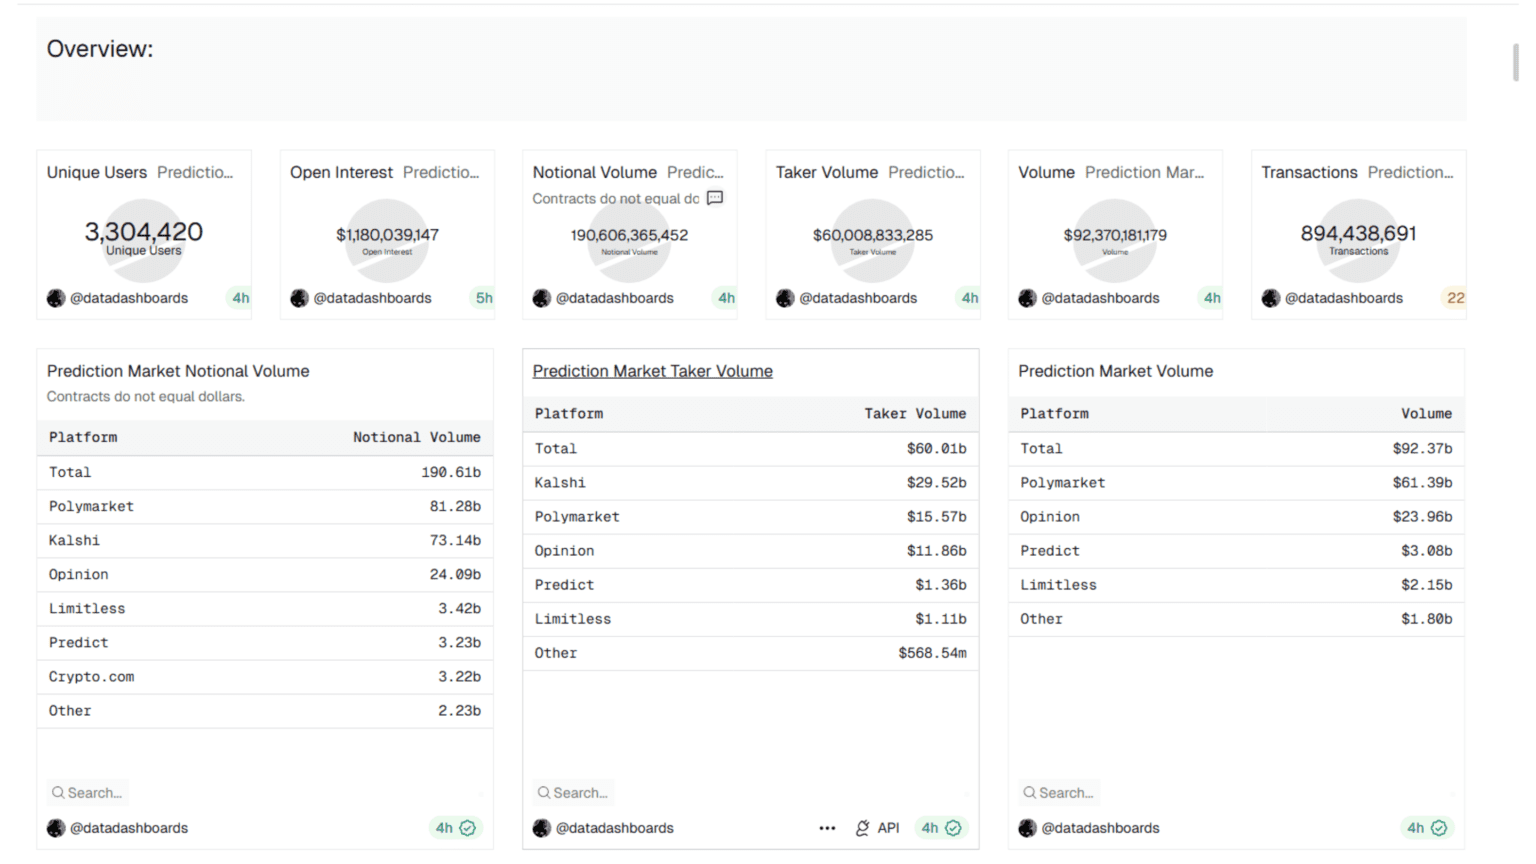
Prediction markets have become an integral part of political forecasting, risk modeling, and sentiment tracking. This dashboard integrates data from platforms like Polymarket and Kalshi.
Key Features
This dashboard helps users understand how prediction markets react to real-world events, which narratives drive liquidity, and which platforms capture the most sophisticated bettors. Rising TVL indicates trust, while notional volume shows leveraged exposure. As 2026’s election cycles intensify, this dashboard provides unmatched clarity.
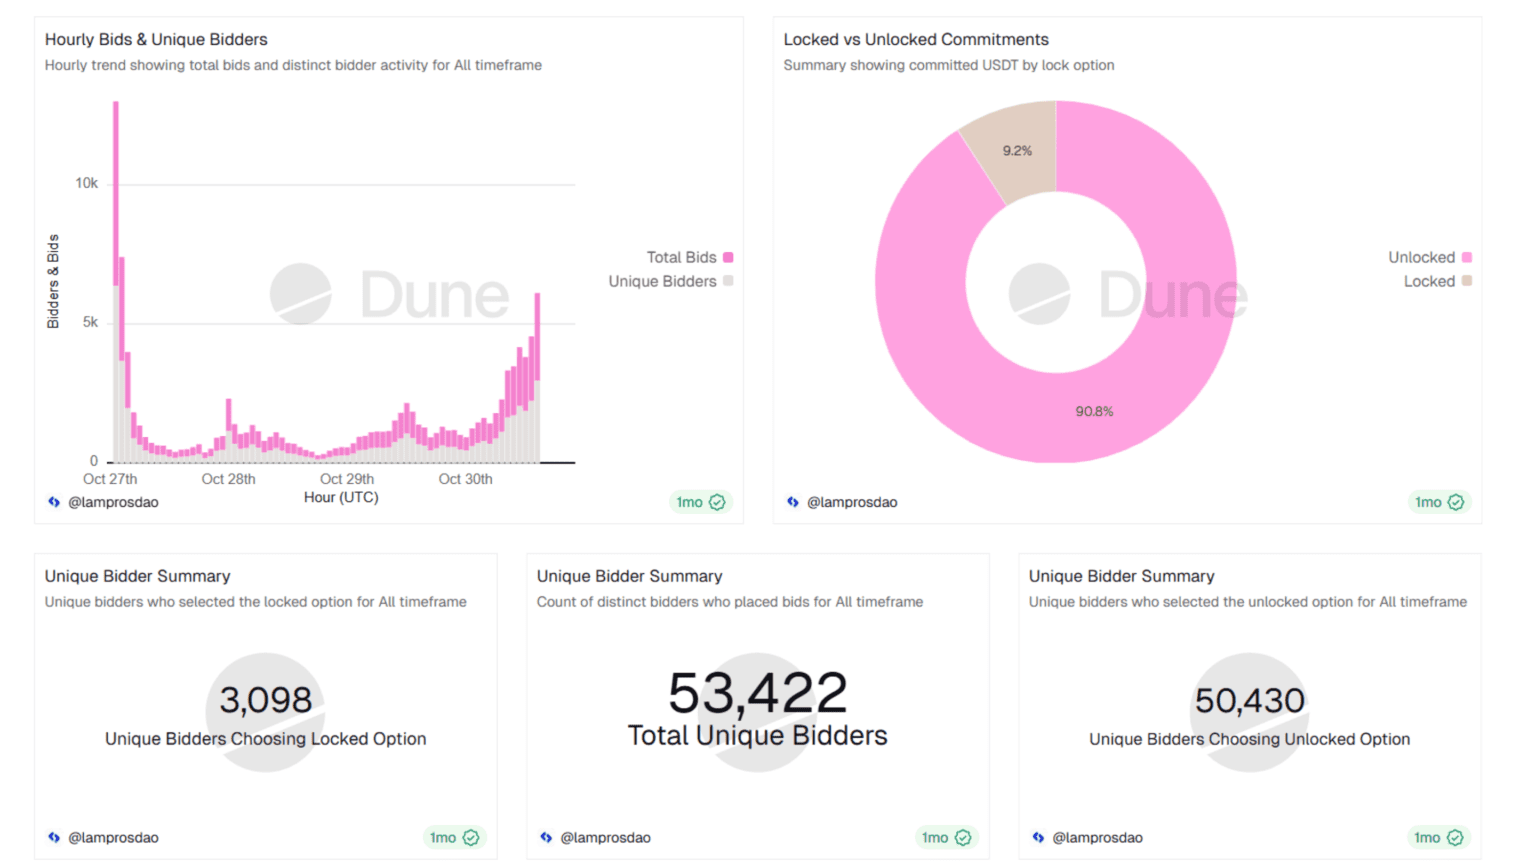
MegaETH is another highly anticipated token sale, and this dashboard tracks contributions, wallet segments, and long-term locked positions.
Key Features
This data reveals whether the sale was community-driven or dominated by institutional capital. Lockup-heavy participation suggests long-term conviction, while broad distribution indicates grassroots support. It serves as a template for analyzing token launches in an increasingly competitive market.
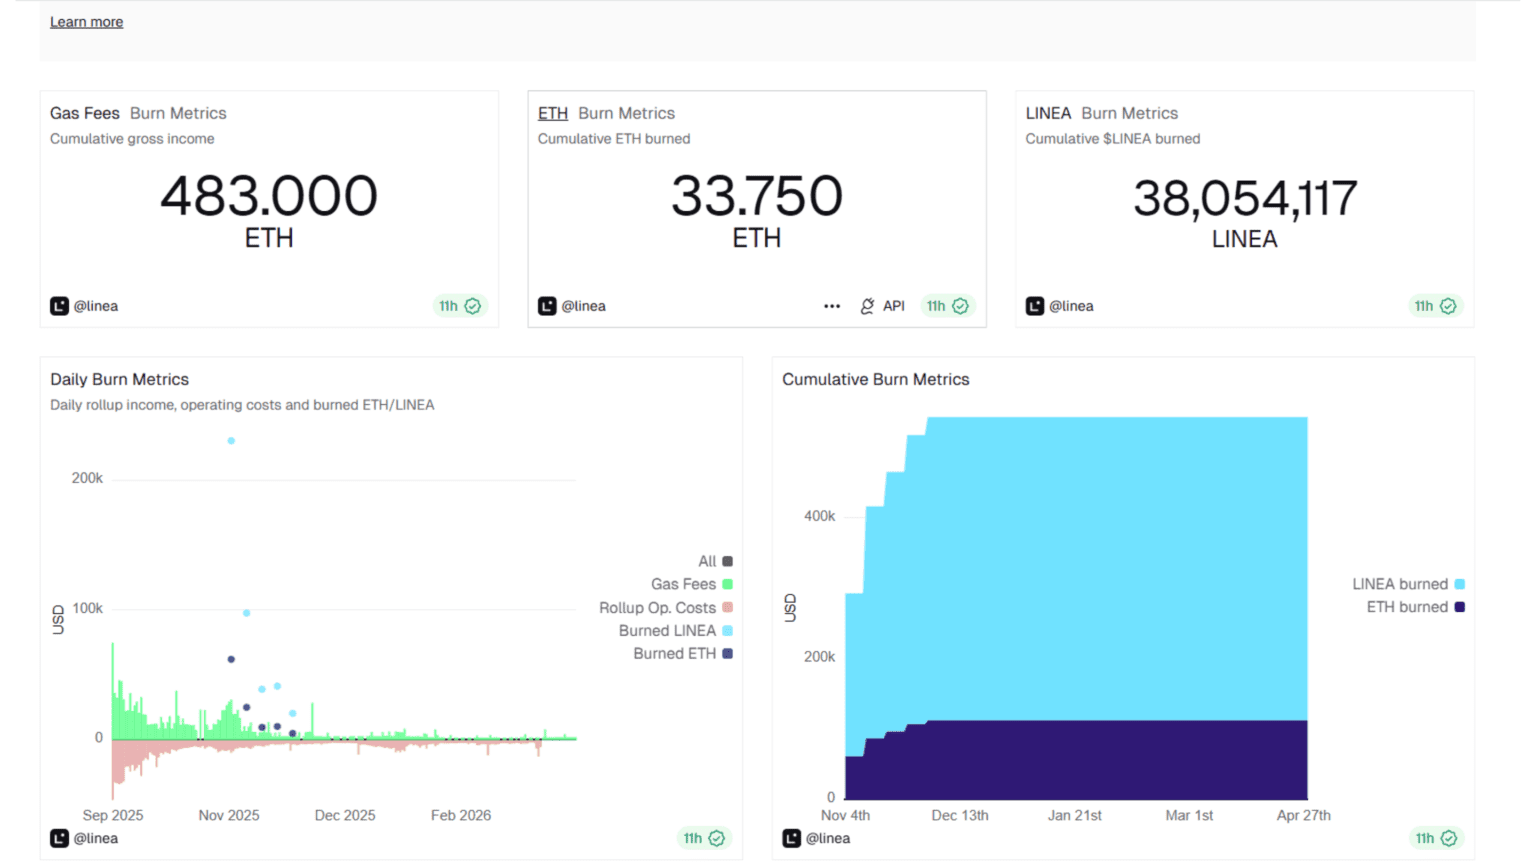
This dashboard analyzes Linea’s burn and fee mechanisms, tracking the token’s economic health and sustainability.
Key Features
Burn curves reveal how active the chain truly is rising burns mean strong network usage, while declining burns suggest slowing demand. Fee income acts as a revenue indicator for validators and ecosystem participants. As rollups compete for activity, this dashboard is essential for comparing L2 economic performance.
Dune Analytics has continued to expand its capabilities in 2026, with updates focused on scale, automation, and real-world data usage. These changes reflect broader trends covered across dune analytics news, where multichain access and AI-driven workflows are becoming standard.
One of the biggest upgrades is chain expansion. Dune now supports data from 130+ blockchains, including newer ecosystems beyond typical EVM networks. This reduces fragmentation and allows users to run cross-chain analysis in a single environment. Instead of switching tools, analysts can track liquidity, users, and flows across multiple ecosystems from one dashboard.
AI integration is another major shift. Dune introduced agent-focused tools like the CLI, Skills framework, and MCP integration. These allow AI agents to query data, build dashboards, and manage workflows without manual input. It changes how users interact with data. Instead of writing every query, they can automate large parts of the process.
On the infrastructure side, Dune added a dbt connector along with Datashare support. This brings production-level data pipelines into the platform. Teams can now transform onchain data using dbt and export it directly into systems like Snowflake or BigQuery. It removes a lot of the friction around ETL and makes Dune usable for enterprise workflows.
Dune also integrated Tempo, a payments-focused blockchain developed in collaboration with Stripe. This adds visibility into stablecoin payments and high-frequency transaction flows, a growing segment in onchain activity.
Finally, the Dune Index introduces a more grounded way to measure adoption. Instead of relying on hype-driven metrics, it combines transaction fees, volume, and activity into a single indicator of real usage.
These updates show a clear direction. Dune is moving beyond dashboards into a full data layer for Web3.
To fully benefit from the Top 10 Dune Analytics dashboards, users should bookmark them, set daily or weekly check-ins, and combine metrics for clearer decision-making. For example, pairing DEX volume trends with ETF inflows or tracking prediction market volatility alongside L2 burn rates can produce insights far more powerful than isolated datasets.
Integrating dashboards into daily workflows gives analysts a more consistent path to alpha. For builders, dashboards validate adoption and guide smarter resource allocation. Traders, meanwhile, gain much-needed clarity in an increasingly competitive market.
As Web3 evolves into a global financial and technological ecosystem, the need for clarity, transparency, and data-driven decision-making becomes non-negotiable. The Top 10 Dune Analytics dashboards highlighted in this article provide exactly that. They reveal how capital moves, how users behave, how protocols grow, and how narratives shift all through verifiable on-chain data.
In a world where misinformation, speculation, and hype can move markets in minutes, tools like Dune Analytics help users keep both feet grounded in reality. They allow traders to anticipate trends before they surface on social media, founders to measure project traction with precision, and researchers to forecast market cycles with unparalleled accuracy.
As we enter 2026, expect even tighter integration between AI and on-chain analytics, deeper institutional participation, and broader usage of dashboards in governance, treasury management, and risk assessment. The future belongs to those who understand the data shaping Web3 and these Top 10 Dune Analytics dashboards are the perfect place to start.