Learn Price Action trading fundamentals, including market structure, support and resistance, breakouts, reversals, and live trade examples.
I’m a former Prop Trader and I’ve been trading Crypto for 8 years. During that time, I’ve learned that Price Action is one of the most important skills a trader can master.
Basic understanding of price action concepts is something that every good trader that I’ve spoken to has in common.
So the goal of this article is to try simplify the basics and pass it over to you. 🤝
🤓NOTE TO READER: I have done my best to simplify all of these concepts as much as possible. Enjoy~
🤓NOTE TO READER: There is a reason why I want to cover this lesson first.
Unfortunately the majority of Traders don’t actually understand the causes for price moving up/down.
There are even some Traders out there who believe that the elites of society created a dark secret predatory algorithm which controls all the price movements in the market and it is designed to hunt stoplosses at certain times of the day. While these theories are popular, they distract from understanding how Price Action actually works in real markets.
I can assure you, the market is not a “super coded algorithm by the elites”… it is a lot more like an auction at eBay.
If the most basic understanding of markets is incorrect or misguided, then all other ideas that the trader is going to come up with are going to be sitting on a very unstable foundation.
The goal of this lesson is to at least get the basics right. That’s it.
This lesson will cover:
As soon as someone is willing to buy something, a market now exists for that something.
A thing doesn’t need to be listed on an exchange with fancy candlestick charts and liquidity providers for it to have a market.
As long as someone wants to buy something then a market technically exists for it.
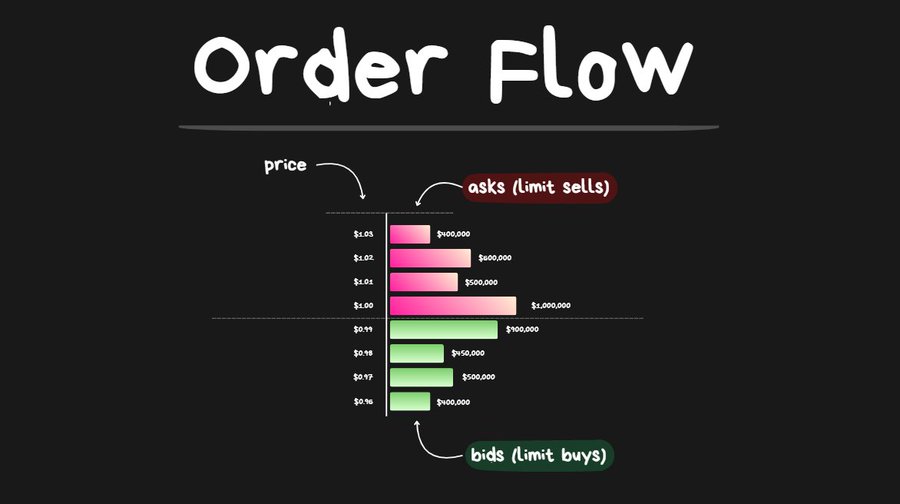
In ALL markets there are Makers and Takers.
Maker:
Taker:
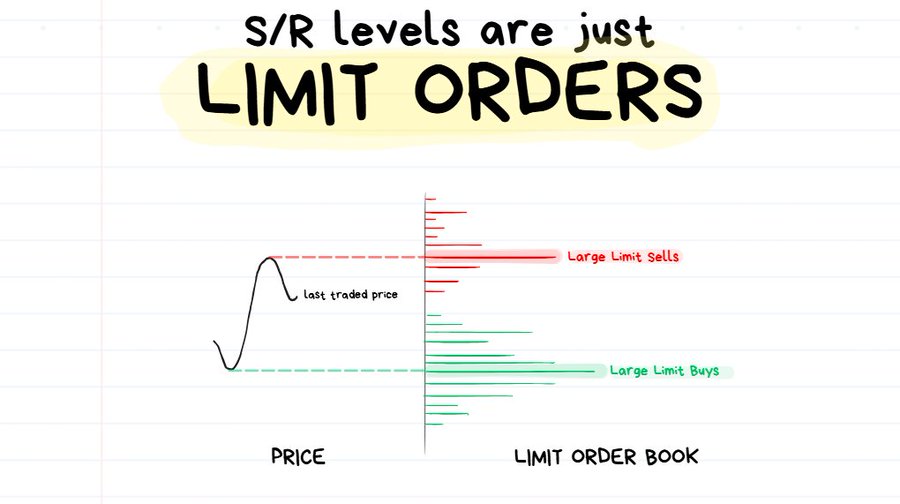
In the Crypto Markets, “Makers” are those who are putting limit orders onto an orderbook. If you were to put in a “limit buy order for 1 BTC at $90,000” then you order will be sitting on the orderbook until price drops down to it.
❗️TIP: “Liquidity” is just a fancy way of saying “how much money is there sitting in limit orders.”
“Takers” are the ones who will be using market orders to execute against the resting limit orders. When you execute a Market Order, you don’t get to choose the price that you get. If you want to “market sell 1 BTC”, your order for 1 BTC will execute at whatever the best limit buy orders are available at the time. Understanding how these market orders interact with liquidity is a fundamental part of reading Price Action.
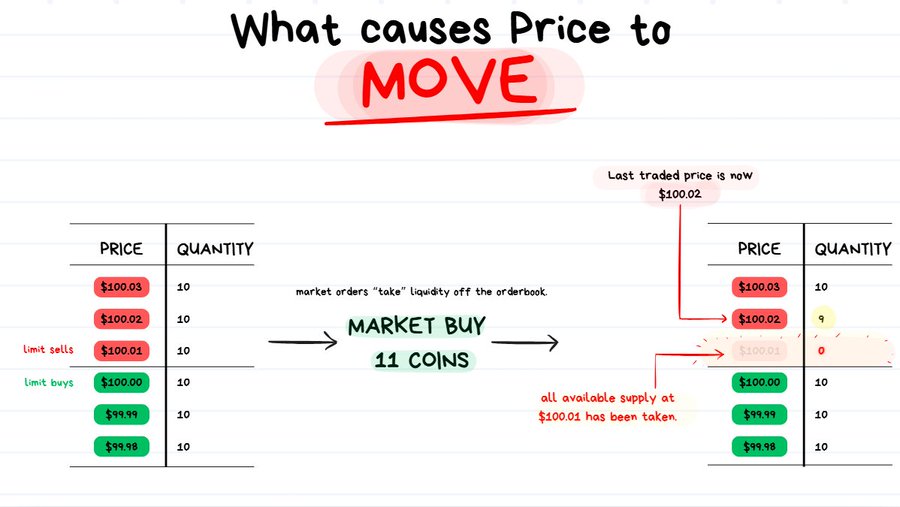
Market moves based on Supply and Demand at certain price points.
Below I’m going to explain Supply/Demand using an analogy with Apples 🍎↓
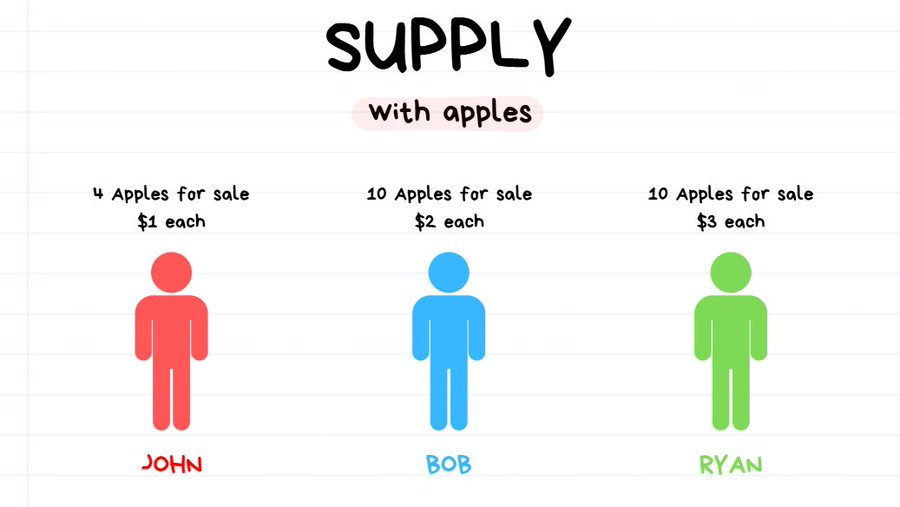
There are 3 Makers (advertising to sell a specific price/quantity) for Apples:
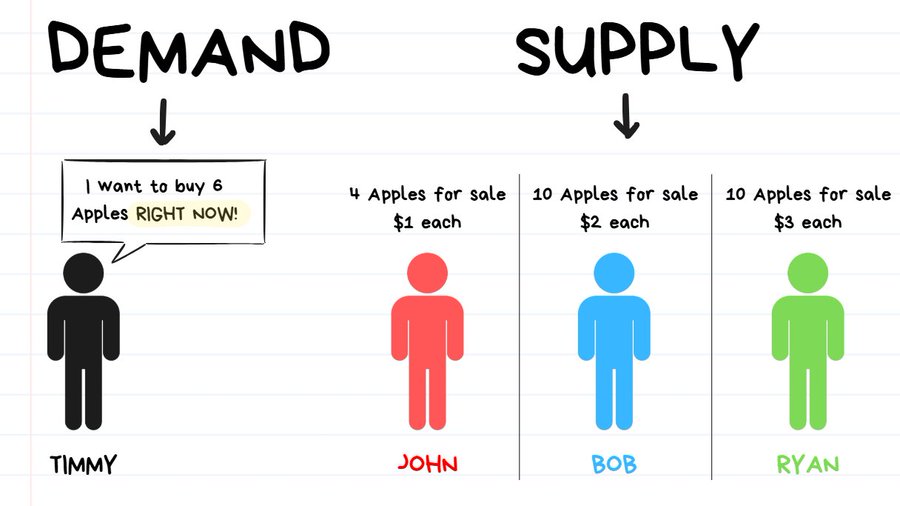
↑ Timmy the Taker has appeared!
Timmy wishes to buy 6 apples immediately. He doesn’t care what price he gets, he just needs 6 apples to cook the best apple pie.
In order for Timmy to act on his intent, he will need to execute a Market Buy for a quantity of 6 apples.
Once Timmy executes a Market Order for a quantity of 6 apples, this is what will happen:
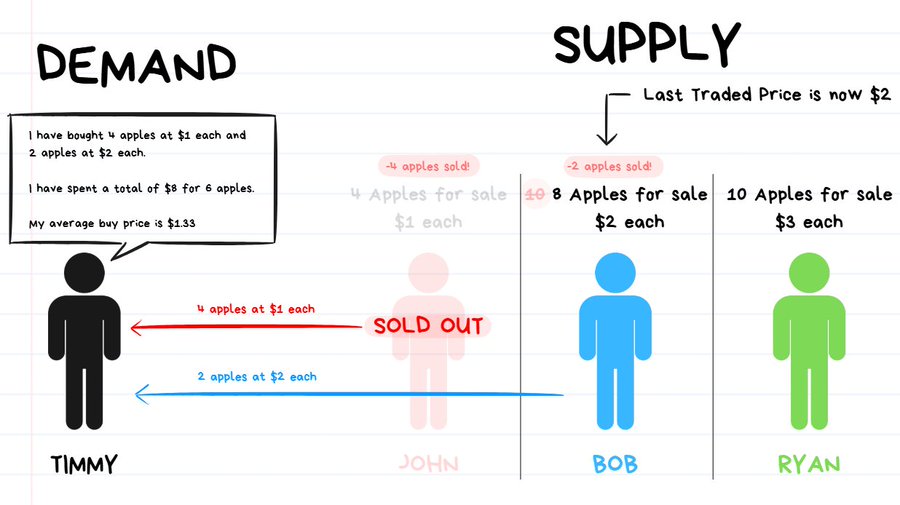
So Timmy bought 4 apples at $1 each ($4 of liquidity taken) and took all the available supply.
Then Timmy bought another 2 apples at $2 each from Bob ($4 of liquidity taken).
So BEFORE Timmy placed the order, the price of apples was $1.
AFTER Timmy’s Market order finished executing, his order resulted in pushing the price from $1 up to $2 because he ate through all the supply.
❗️TIP: So basically whenever demand exceeds supply at a certain price point, the price will move.
Price doesn’t move because of secret algorithms. It moves because of supply and demand between buyers and sellers.
Price moves when market orders (demand) consume the available limit orders (supply) at a given price. If a large market buy eats through all sell orders at $1 and starts filling $2 orders, the price rises to $2.
👉 In short: Price = the result of market orders hitting the orderbook.
The topic of support/resistance is a rather simple topic.
Unfortunately, Traders have a unique talent for finding ways to overcomplicate basic concepts and confuse themselves in the mess that they have created.
The goal of this lesson is get crystal clear clarity on Support/Resistance and remove any potential confusions.
This lesson will cover:
Out in the vast space of social media are a whole bunch of influencers who try to create fancy-sounding ways of drawing different types of support/resistance levels.
Behind all the fancy “order blocks” and “price delivery zones” (or whatever other terms are used) is literally just a bunch of limit orders.
Ultimately, as discussed in the previous lesson, price moves purely based on Limit Orders and Market Orders.
So price is never bouncing off the “magical lines” (or boxes) that you draw on your chart. It is bouncing off the limit orders on the orderbook.
❗️TIP: The lines that we draw on the chart are just to help us visualize where large clusters of limit orders are sitting.
The thing is I could draw a random line anywhere on the chart and behind it are probably going to be some limit orders.
This means you can draw literally any line on your chart and you could technically call it a valid support or resistance level.
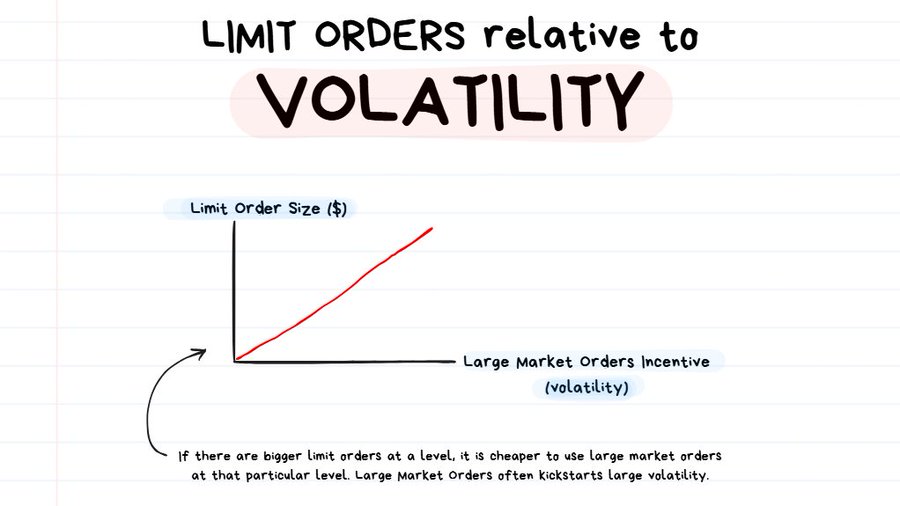
If there’s a lot of money in limit orders at 1 price, there’s more incentive to use market orders at that point since the slippage for large orders is at its lowest.
Since market orders are responsible for moving price up/down, we can expect to see a lot of movement once price hits a large limit order and starts moving away from it.
So basically there’s no such thing as “strong levels” or “weak levels”… yep I’ve said it. 🤷♂️
It’s not about “weak” or “strong”, it’s just about how much $$ in limit orders is sitting at a level relative to the other nearby limit orders.
More money sitting at a level in limit orders does not necessarily mean a higher likelihood of a “bounce” from the level (which is most commonly assumed).
It just means that we can expect to see a more volatile reaction once price gets closer to the level since big limit orders often incentivize big market orders to come through, which then cause big price movements.
If there’s very small limit orders at a level, then regardless if the price reverses or does a breakout it’s unlikely to be a wild move because there just isn’t “that much fuel for the fire to use.”
🧠3 BONUS TIPS ↓
❗️TIP #1: Big/Round Numbers which are in multiples of 10 (e.g. $1, 10, $10, $50… etc.) often have large limit orders stacked on them. This is why we see frequent violent reactions from these levels.
❗️TIP #2: For more advanced (or curious) Traders, you can use the platform @tapesurfapp to see where the limit orders are. I’m not affiliated with them in any way, I just think their platform is super cool.
❗️TIP #3: The more time that price has spent away from a level = the more time the market as a whole has to place limit orders at that level = the bigger the reaction can be expected once price returns to that level again.
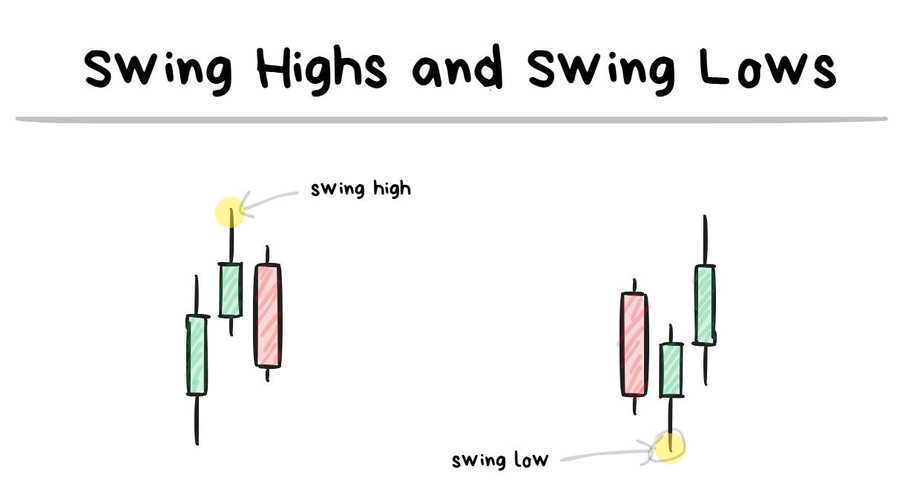
🤓NOTE TO READER: A swing point (high or low) requires at least 3 candles to be formed. Swing highs is when the 2nd candle has the highest extreme and a swing Low is when the 2nd candle has the lowest extreme.
These are the easiest price-action based support/resistance levels to use because of how simple it is to identify them and be consistent when using them.
I want to give some Simple Examples of using swing highs/lows below ↓
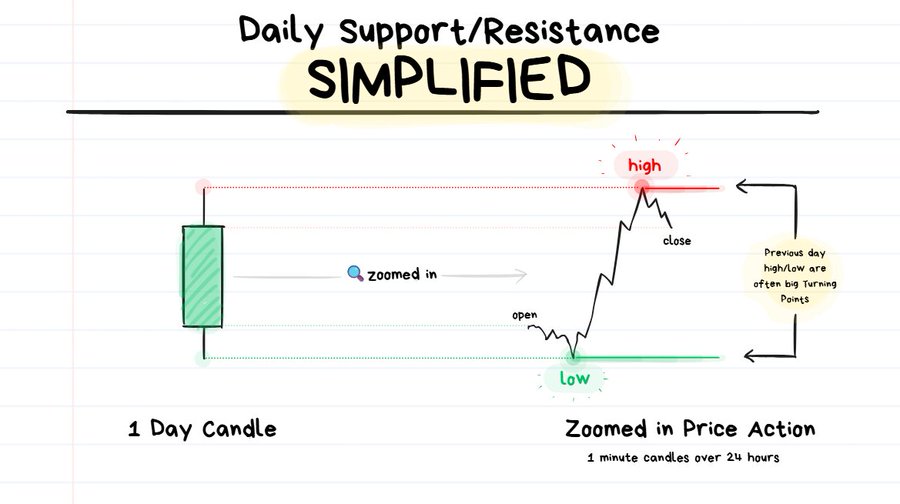
When you are looking at a 1 Day Candlestick and then you zoom into it by changing timeframes, you will get a chart which looks like something on the right hand side of the image above.
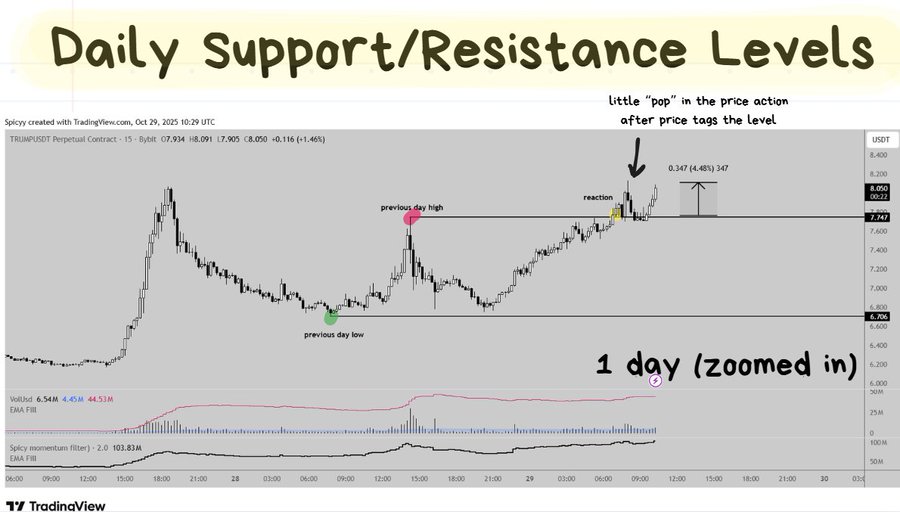
The highest and lowest points of the day often have a lot of limit orders placed near them.
A lot of market participants make their decisions based on the highest and lowest points of the day.
It is a frequent used area for traders to enter trades and also exit trades, which often causes there to be a lot of activity around these types of levels.
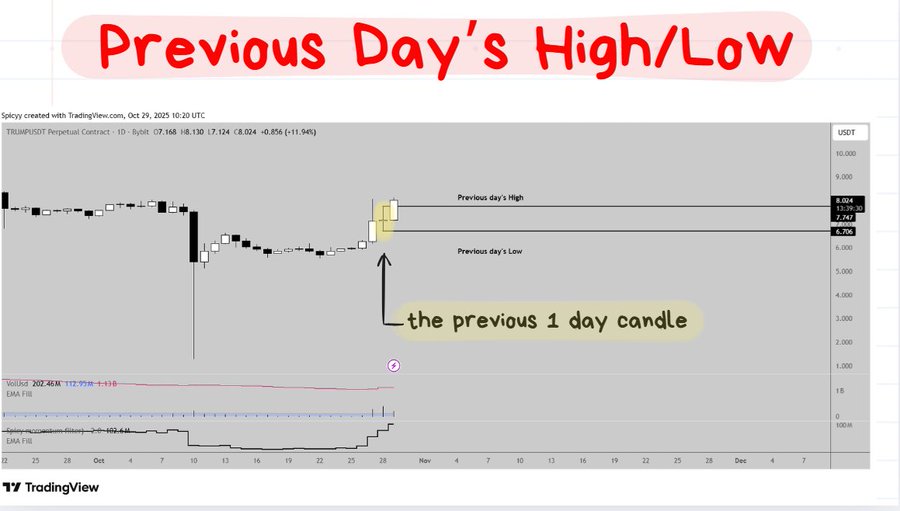
The Previous Day’s High/Low is one of my favorite S/R levels to trade from because of how easy it is to be consistent with execution.
When levels are drawn in the exact same type of way for every single trade, the trades become more consistent.
❗️TIP: The High/Low of the previous X units of time will always appear as a swing high or a swing low. This is because it is only looking at the extreme points.
As executed trades become more consistent, the trades become easier to review and make improvements to.
When you zoom into the previous day’s candle by switching to a different timeframe you’ll often be able to see how the previous day’s highs/lows were key turning points throughout the day.
When price returns to a place where a lot of volume was previously executed (which are often the key turning points), it often has a lot of volume executed there once again.
This is why we so often see more violent reactions once price reaches one of these key levels.
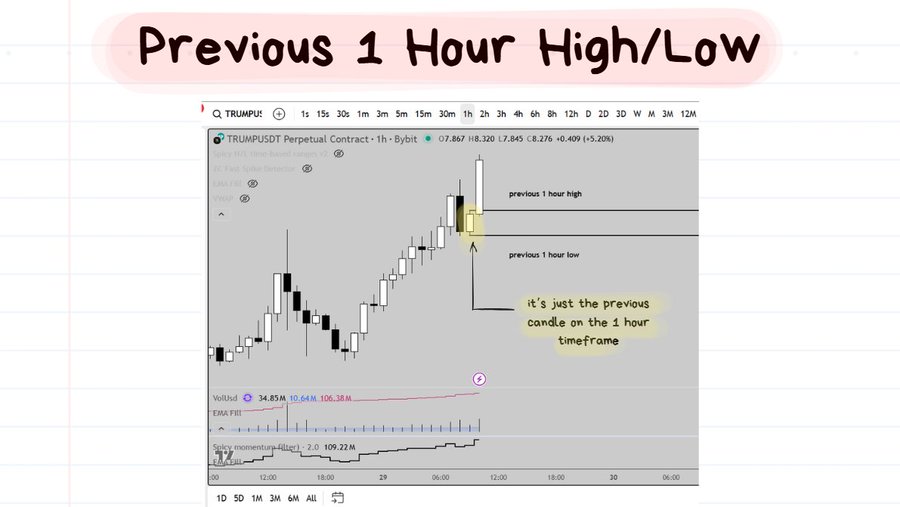
Super simple:
Switch to the 1 hour timeframe.
Find the high/low of the previous 1 hour.
❗️TIP: You can use the Magnet Tool (bottom left hand corner of tradingview) to “snap” to the highs/lows.
Then Zoom into the 1 minute timeframe. ↓
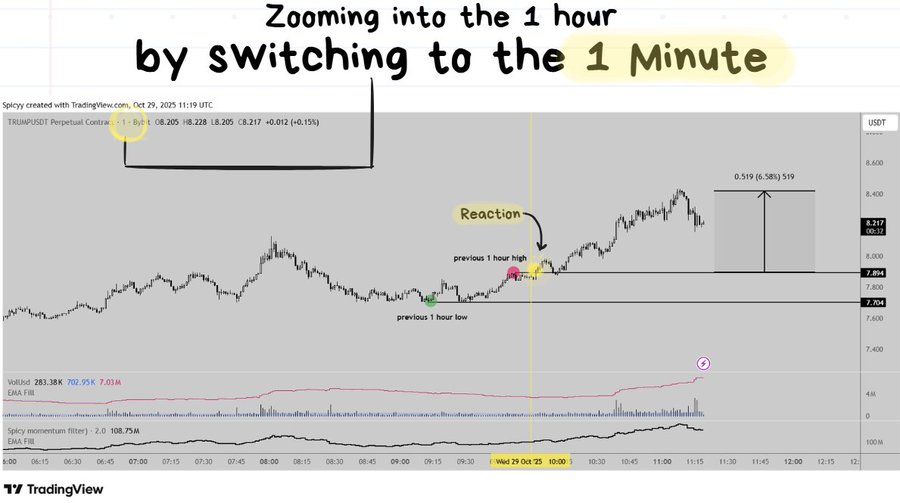
The idea here is the same as the 1 day candles. The highest and lowest points of the previous 1 hour can often have violent reactions.
Support and resistance aren’t “magical lines”. They are just clusters of limit orders.
👉 In short: Support/resistance = where real money (limit orders) sits. Trade from clear swing highs/lows and round-number levels if you want to simplify your execution and also make it more consistent.
In this lesson we’re going to cover:
🤓NOTE TO READER: Before diving into the lesson I want to give some quick context.
When price approaches any support/resistance level we as Traders have 3 types of decisions that we can make:
Before we take a trade, we have to assess multiple variables to see which of these 3 decisions is the most appropriate to make at the time.
As a Trader you have to get used to picking Option 3… a LOT.
Okay let’s get into the Lesson now ↓
Before jumping into a trade it can be quite helpful to have a little bit of context.
Looking at the current Market Structure is a good place to start.
❗️TIP: Look at the swing highs and swing lows created in the price action when trying to judge the market structure.
Just because price currently has Bullish Structure doesn’t mean that it will just go up forever.
There are going to be times where the structure “breaks” and price can potentially turn around and start moving in another direction.
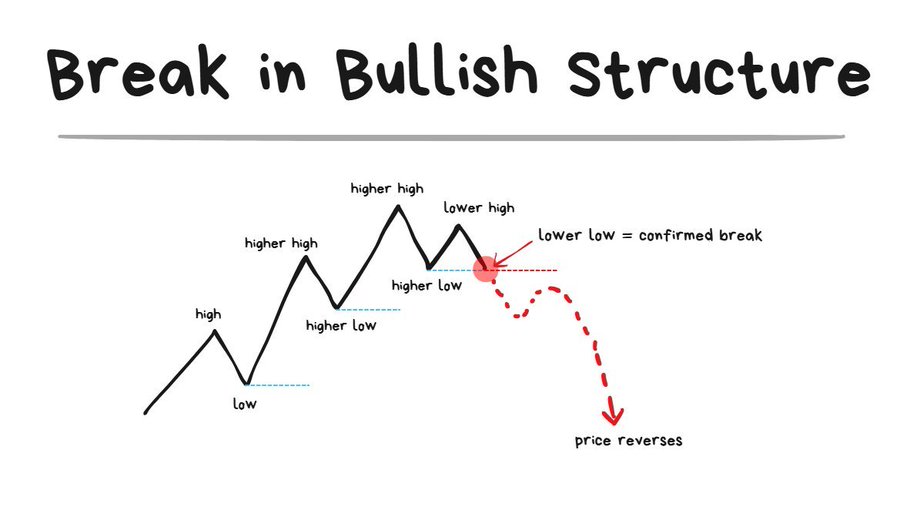
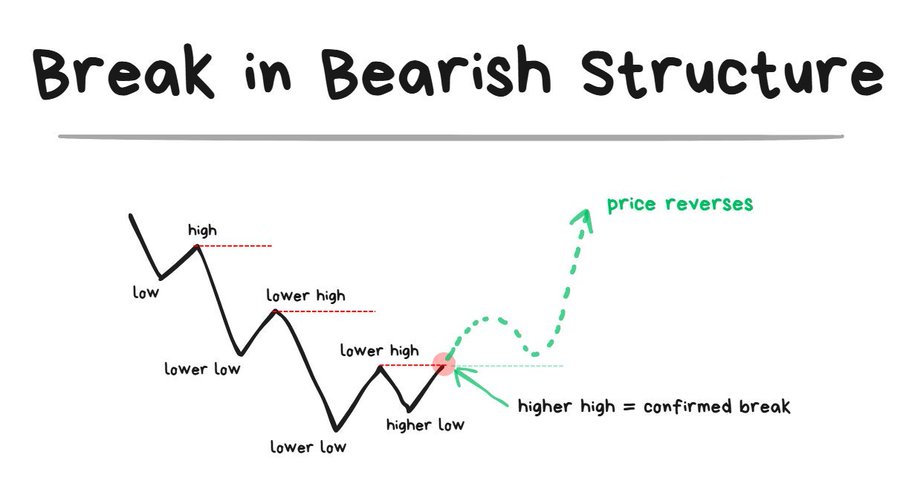
Live Trade Example of using a Break of Structure ↓
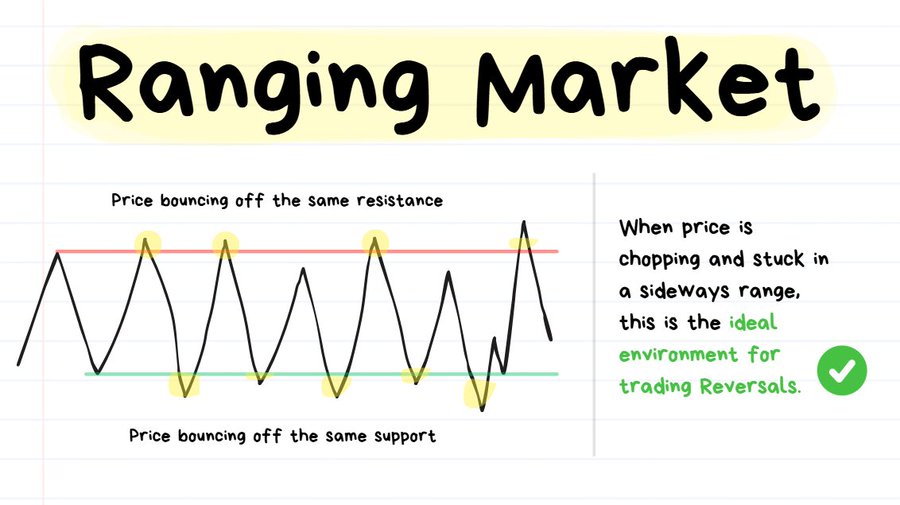
❗️TIP: “Mean Reversion” means “reverting back to the mean” or “reversing back to the average/middle price.”
When the direction of price isn’t clear because it just keeps reversing from the same highs/lows over and over again, this is a Mean Reverting Environment.
This type of environment is:
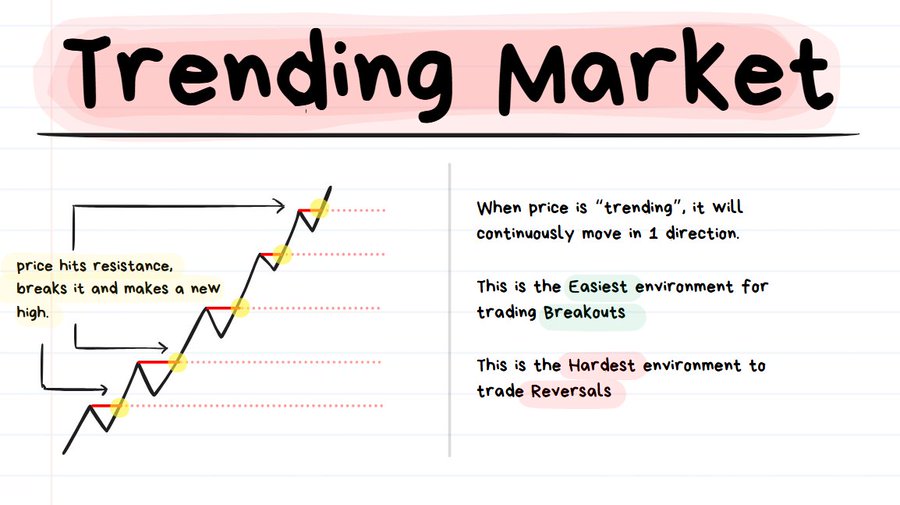
❗️TIP: “Trending” means that price is consistently moving in 1 direction. If it’s an up trend then price is consistently going up and if it’s a down trend then price is consistently going down.
When the Market Structure of a move appears to be Bullish or Bearish for a consistently long duration of time (it’s more about total # of candles rather than units of time, since this concept holds true for all timeframes), then you’re looking at Trending Price Action.
Common characteristic of strong Trending Price Action:
This type of environment is:
🤓NOTE TO READER: This next concept had a huge impact not just on my trading but also in the overall quality of my decision-making. Of all the things discussed in this article, I hope this specific concept is the one that gets retained in your memory.
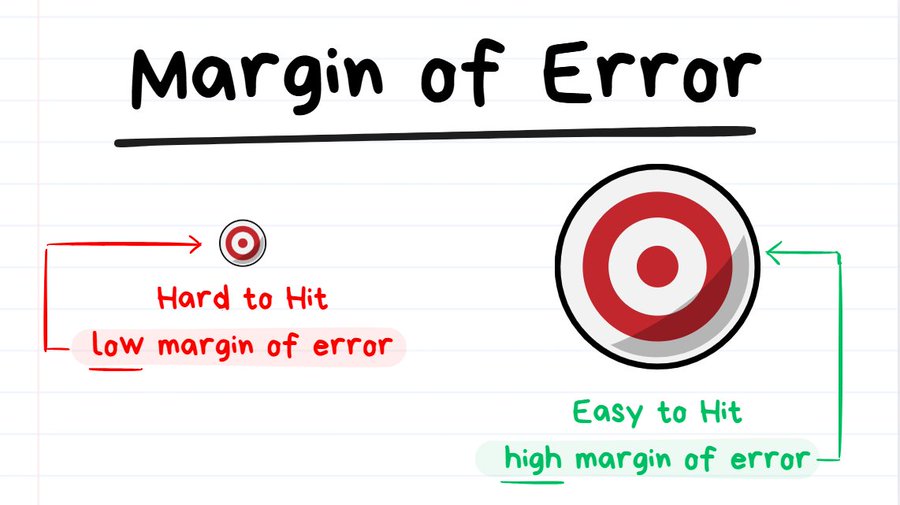
There is a reason why some environments are great for reversals and others are great for breakouts.
The reason is due to the “Margin of Error” that’s available.
I want to quickly give the Poker analogy for this ↓
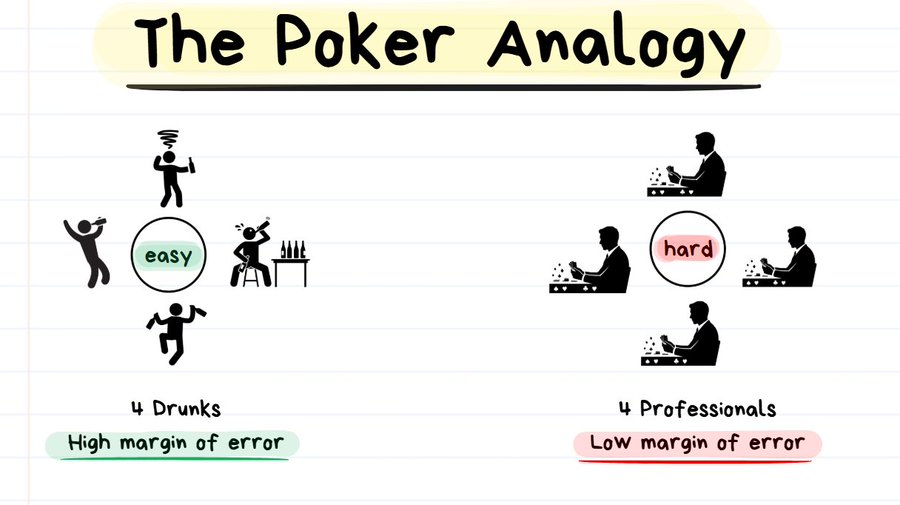
Despite you having the exact same level of execution skill, it’s more likely that you perform better against the 4 Drunk Players rather than the 4 Professionals.
With the 4 Drunk Guys, you can make plenty of mistakes and you won’t be exploited for them. They will make plenty more errors than you, so you just have to be there to take advantage of the mistakes. Your margin of error is HIGH in this situation.
With the 4 Professionals, every mistake you make is a really big deal. You will be punished very harshly for every error and you will need to play perfectly. Your margin of error is LOW in this situation.
Imagine that BOTH situations (playing against the drunks or the pros) had the SAME PAYOUT… Then it would be a no-brainer to just only play against the drunks and to stay away from playing against pros.
🤓NOTE TO READER: Below I will explain how Margin of Error is relevant in Trading ↓
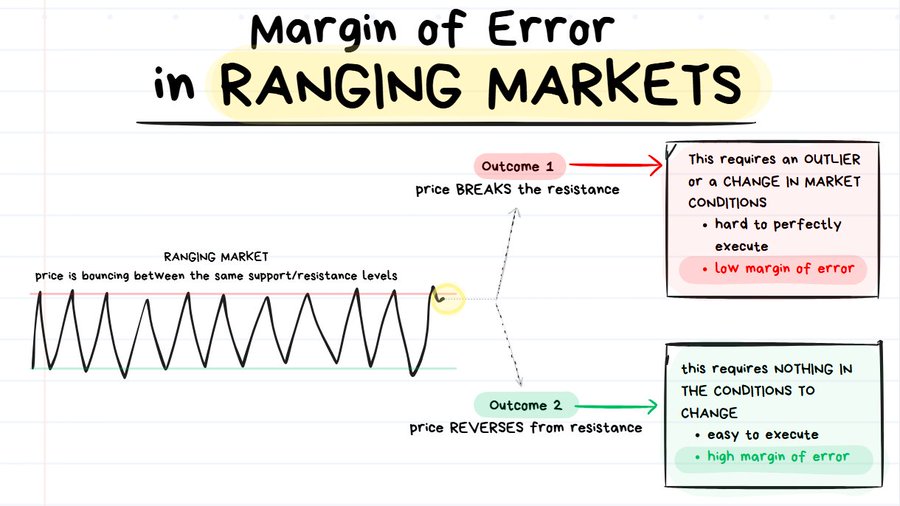
When price is stuck in a range and then approaches a resistance level there are 2 possible things that can happen:
Let’s compare the margin of error with playing the reversal and playing the breakout.
THE POINT ↓
As we can see, this price action gives A LOT OF ROOM for mistakes when trading reversals and VERY LITTLE ROOM for mistakes when trading breakouts.
A low quality reversal strategy would perform very well in this environment however even a highly optimized breakout strategy would really struggle in this environment.
🤓NOTE TO READER: The little section below with the Trending Markets might sound a bit repetitive. I just really want to emphasize the point here.
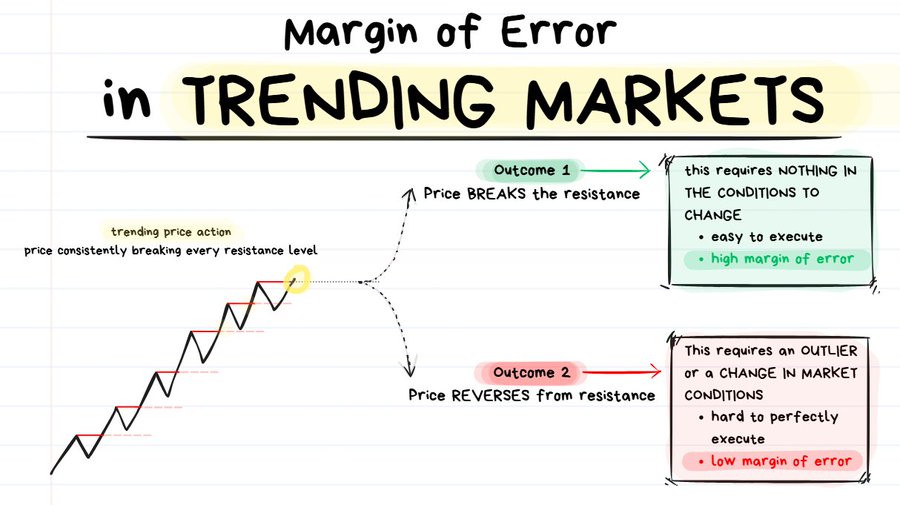
When price is consistently trending in 1 direction and then approaches a resistance level there are 2 possible things that can happen:
Just like in the previous example, let’s compare the Margin of Error with both the outcomes.
Every trade fits one of three decisions: 1️⃣-> Bet on a breakout (momentum). 2️⃣-> Bet on a bounce (mean reversion). 3️⃣-> Take no trade.
Your job as a Trader: identify the environment and choose the option with the highest margin of error (most room for mistakes).
1. Market Structure
2. Market Environments
A. Mean-Reverting (Ranging)
B. Momentum (Trending)
3. Margin of Error 🧠
4. Applying It
In ranges -> reversals have high margin of error. In trends -> breakouts have high margin of error. Trade with the environment, not against it.
🤓NOTE TO READER: Well done for pushing this far into the article. Just 1 final lesson to go. ↓
So I’m getting really close to the image limit on this Article (yes… X articles have image limits) so unfortunately I can’t ramble on with more theory.
This final Lesson will include:
⚠️Quick Disclaimer: I have “cherry-picked” winning trade screenshots below. I can assure you that I do not have a 100% winrate , it’s actually sitting somewhere between 55-60%~.
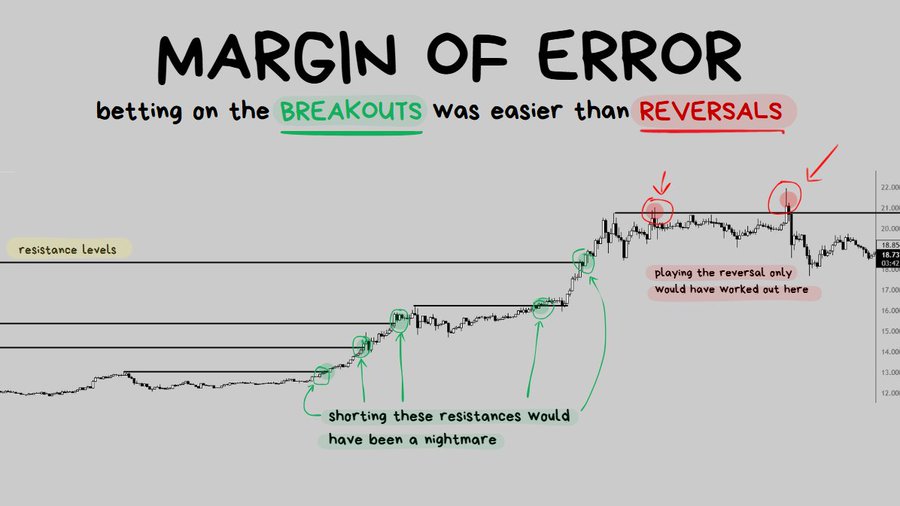
🤔Quick Context: There are many influencers who say things like “you should only be shorting resistance, longing it is stupid!” Unfortunately they don’t have a clue what they’re talking about. Under specific circumstances (when margin of error is really low) shorting resistance can be a really bad idea. I want to emphasize this with 5 examples below.
Price was consistently breaking resistances over and over again.
The play here was “whatever was happening, I’m going to bet that nothing is going to change and it’s just going to keep happening.”
Extra Confluences:
Looks pretty much identical to the trade above:
This is a perfect example of “would rather be long until I’m wrong rather than short until I’m right.”
All Traders who were furiously shorting every resistance were not having a fun time during this trend.
This one is a bit more of a “steeper” and “more extreme” example, but the concept remains the same.
Margin of error for breakout trading was very high but for reversals it was very low.
Even if I botched the entry and mistimed the exit the market would have rewarded me… but for trading the reversal I would need absolute perfect and very precise execution.
You must be tired of seeing the exact same price action, same thing in volume, same behavior of price exploding through every visible resistance…
… if yes, then get used to it because this is how consistent execution feels like.
Taking the exact same trade in the same conditions with similar outcomes over and over again.
I’m trying to drill the repetition here to show that these specific scenarios are generally VERY UNFAVORABLE for going for the reversal trade which inversely makes it VERY FAVORABLE to attempt going for the breakout instead.
Same exact thing. Margin of error is really high on this one.
Staircase-like price action (cleanly breaking through every resistance) on increasing volume is REALLY NICE for trading breakouts and I will continue to repeat it over and over again.
🤓NOTE TO READER: Hopefully my words and this price action pattern gets tattooed into your memory.
Below I’m going to dump 5 Bonus resources/materials which you may find helpful.
Enjoy! ↓
1. How I trade Breakouts
2. How I trade Reversals
3. How I use Crypto Screeners to make it easier to tell if I should be focusing on Breakouts or Reversals
4. Volume Masterclass
5. Thread on Price-Action Confirmations
🧠 Margin of Error Concept