The Art of Executing long-term crypto trades with token buybacks, revenue analysis, and supply metrics to evaluate altcoins.
The Art of Executing a good long-term crypto trade starts with understanding what drives a token’s value. Over the past few weeks, we have watched several memecoins rise and then fall. For the first time, I felt FOMO about trading them. I won a few trades at first, but I lost money on nearly 90% of my trades.
I’m still a young fool. I don’t have millions sitting around to trade memes like 80% of Crypto Twitter seems to do. For now, I’ll stick to trading altcoins until I develop an edge in memecoins or find a new casino L2 or L1. But, for fuck’s sake, alts are still down bad. Every day, I feel poorer because I have no edge in this casino.
That’s why I’m writing this article. I want to evaluate an altcoin’s trajectory, token emissions, revenue, and buybacks. My goal is to hold spot positions with more confidence. I don’t want to keep chasing the next meme or launchpad token on a new L2. I hope you learn a thing or two about valuing crypto tokens over the long term as you read this.
well i begin with the most popular protocol in the buyback business @hyperliquidx
hyperliquid earned about 871 million dollars in the twelve months to june 24, 2026. that is the biggest revenue number of any onchain app, per @grayscale‘s stack report built on artemis data. it also runs the biggest buyback in crypto. and it still added more tokens than it removed over the same period.
that sentence is the whole point of this article.
When people talk about “buyback tokens,” they usually mean protocols that earn money and use some of it to buy their own tokens. That is a good thing, but it tells only half the story for holders. The other half is how many new tokens the protocol creates at the same time. For example, if a protocol buys back 10 tokens but releases 100 new ones to its team and investors, holders end up worse off, no matter how impressive the buyback announcement sounds.
so this article does something simple. for each token, it asks two questions. how much money does the protocol make, and why? and does the buyback actually beat the new supply? the second question has a single equation behind it. i will explain it in plain words first, then run ten tokens through it. you can run it on anything you hold in about five minutes.
my equation is simple i call it the anti dump equation.
count the tokens the protocol takes out of the market in a year, count the tokens it adds in a year, divide the first by the second.
bcr = (k × b) ÷ (u + e)
here is what each letter means.
b represents the number of tokens a protocol bought back with its revenue over the past twelve months. In other words, it measures the buyback.
k describes what the protocol does with those tokens after the purchase. If the protocol burns them by sending them to an address nobody controls, they disappear permanently, and k equals 1.
If the protocol keeps the tokens in a treasury or trust, it removes them from circulation for now, but could release them later. In this case, k equals 0.5.
When the protocol distributes the tokens directly to stakers, they remain in circulation, so k equals 0.
u represents the number of tokens that will unlock over the next twelve months. This includes team vesting, investor vesting, and foundation releases, which projects typically publish in advance.
e is emissions. new tokens the protocol creates as staking rewards or liquidity incentives over the next twelve months.
bcr is the buyback coverage ratio. it tells you how much of the new supply the buyback covers.
reading the result is easy.
one more line:
net change = (u + e − k × b) ÷ c
c is circulating supply. a negative result means your share of the token got bigger over the year. a positive result is your dilution rate.
try and understand my three design notes, then the list.
Why k exists: The term “buyback” can describe three different outcomes. Burned tokens are gone permanently, while tokens held in a treasury may later be spent on grants or incentives. When tokens go directly to stakers, the mechanism acts more like a yield payment than a supply reduction. Treating these outcomes equally can mislead investors.
Why tokens, not dollars: The same equation can be expressed in dollars by dividing revenue allocated to buybacks by the dollar value of new supply. Because price cancels out, using token amounts is simpler. Unlock schedules are also published in token units, making the comparison more straightforward.
Why trailing burns are compared with forward unlocks: Buybacks depend on revenue and usage, so their future size cannot be scheduled with certainty. Last year’s burn provides a practical estimate for the next twelve months. By contrast, scheduled unlocks can be measured using published forward figures. If revenue is declining, the actual coverage ratio may be lower than the one shown.
With those design choices explained, let’s move on to the token-by-token analysis.
1. ray (@raydium) | bcr is about 5.1 | float shrinking about 3 percent a year
what it is: raydium is the main automated market maker on solana. when you swap tokens on solana, a large share of that volume routes through raydium pools.
how it makes money and why. raydium charges a small fee on every swap, usually 0.25 percent. it earned about 46 million dollars in the twelve months to june 24 per grayscale’s artemis-based list. that number comes from two things: solana memecoin trading, which is cyclical, and a newer, steadier source, tokenized stocks. raydium’s @xstocksfi integration did about 1.63 billion dollars in trading volume in q2 2026, tripling year on year. on september 9 raydium recorded its largest ever single buyback of about 641,000 dollars, funded by fees from a week where @launchonsf moved all its launches to raydium’s launchlab and tokenized stocks started routing through raydium.
Will it continue? Yes. Memecoin mania will rise and fall with Solana sentiment, as long as the American dream remains alive. Tokenized stocks offer a newer source of demand, and that market continues to grow. More importantly, the protocol hardcodes its fee split: 12% of every trading fee automatically funds RAY buybacks, without requiring a governance vote. Raydium has maintained this mechanism since 2022 without interruption.
The equation: Raydium bought back about 20.3 million RAY over the past twelve months. It holds those tokens at a public on-chain address rather than burning them, so (k = 0.5). Approximately 2 million RAY will unlock over the next twelve months, most of which comes from the 1.9 million RAY the mining reserve releases annually as staking rewards.
(0.5 × 20.3) ÷ 2.0 = 5.1. the protocol removes about five tokens for every one it adds.
what people are saying. specifically added this to show you guys contecxt and other people projections and all. when the buyback pace hit its 2026 high in early august, raydium’s official account posted three words: “deploying more capital.” grayscale’s stack post lists raydium at 46 million dollars in revenue
the catch. cumulative buybacks now exceed 30 percent of circulating supply, but they are held, not burned, so a future governance decision could put them back into the market. revenue is small compared to the names below. and ray nearly doubled in the week to september 10, so the buyback buys fewer tokens per dollar now than it did in august.
2. @bnbchain | no dilution | supply shrinking about 4.5 percent a year
what it is. bnb is the gas token of bnb chain and the exchange token of @binance.
How it makes money and why: Two mechanisms reduce BNB’s supply. First, BNB Chain burns about 10% of its gas fees in real time with every block under BEP-95. Second, the quarterly Auto-Burn destroys tokens independently of protocol revenue. Its formula uses BNB’s average price and the number of blocks produced during the quarter.
On July 15, the 36th Auto-Burn destroyed 1,615,827 BNB, worth about $932 million, and reduced total supply to approximately 133.17 million BNB. The program will continue until supply reaches 100 million.
Will it continue? Yes, under the current rules. BNB’s tokenomics include the Auto-Burn mechanism, which has operated every quarter since 2017. The token has no scheduled unlocks or emissions. However, a price decline could reduce the dollar value of each quarterly burn because the formula adjusts the amount burned according to BNB’s price. That remains the mechanism’s main weakness.
the equation. unlocks 0, emissions 0. trailing annual burn about 6 million bnb. k is 1.
nothing to cover. supply shrinks about 6 million on 133 million, roughly minus 4.5 percent a year.
what people are saying. bnb chain’s official account announced the 36th burn with the exact figure and transaction id, and noted that future burns happen directly on bsc.
the catch. this is a burn token, not a revenue-share token. only bep-95 ties the burn to real usage. the rest is a formula. and the whole thing rests on binance staying dominant and staying licensed in the places that matter. on the one question this article asks, whether supply shrinks, bnb has answered yes for nine years.
3. uni (@uniswap) | no scheduled dilution | float shrinking about 1 to 4 percent a year
What it is: Uniswap ranks as the largest decentralized exchange by trading volume across Ethereum and more than a dozen other chains.
How it makes money and why: For years, Uniswap did not direct swap fees to UNI holders. Instead, liquidity providers collected those fees. That changed on December 28, 2025, when the protocol executed its Unification proposal. The upgrade activated protocol fees on Uniswap v2 and selected v3 pools, then expanded them to v4 and eleven chains.
Those fees now flow into contracts called TokenJars. Anyone can claim the assets inside a TokenJar by burning an equivalent value of UNI. This design removes the need for a committee to manage buybacks. Instead, users claim the accumulated fees themselves, and each claim permanently burns UNI.
the revenue number is the reason the burn is small. grayscale’s list shows uniswap at about 49 million dollars in the twelve months to june. artemis measured the run rate at about 25 million in january. that is tiny against the billions in swap volume, because the protocol fee is a thin slice (about 7.9 percent of total fees by one estimate) and only some pools have it on.
then robinhood chain launched on july 1 with uniswap as its main exchange. robinhood chain’s volume is mostly speculative token launches and tokenized stocks, and uniswap handles up to 98 percent of it. by early september, robinhood chain was contributing about two thirds of uniswap’s protocol fees, and on september 4 the daily burn crossed 1 million dollars for the first time (about 184,000 uni, with about 150,000 of those paid for by robinhood chain traders).
will it continue. the mechanism will. the revenue level depends on whether robinhood chain volume holds, and on whether governance turns on fees for more pools. the robinhood chain launchpad volume is the kind that spikes and fades. the tokenized stock volume is steadier. the honest answer is that the fast burn rate is about ten weeks old.
The equation: UNI has no scheduled unlocks because team and investor vesting ended in 2024. The original contract also included a 2% perpetual inflation rate, but the protocol never activated it, leaving emissions at zero.
Buyback estimates vary by period. At January’s pace, Uniswap burned about 4 million UNI annually, equivalent to roughly 0.7% of the 624 million circulating supply. By September, one analyst estimated an annual burn worth about $90 million, or approximately 4% of circulating supply at the relevant prices. Since Uniswap permanently burns the tokens, (k = 1).
no scheduled dilution. any burn makes uni net deflationary. the range is minus 1 to minus 4 percent depending on which run rate you believe.
what people are saying. when unification executed, uniswap’s account listed what had happened and closed with three words: “let the burn begin.” post:
the catch. uni trades at about 37 times trailing revenue on grayscale’s list, the most expensive on the list by far. the market is paying for the september run rate, not the january one. and two thirds of that run rate comes from a chain that did not exist ten weeks ago.
4. trx (tron) | bcr about 0.76 | supply growing about 0.4 percent a year
what it is. @trondao is the blockchain that settles more usdt than any other. about 88 billion dollars of usdt sat on tron at the end of q2 2026.
how it makes money and why. every transaction on tron costs bandwidth and energy. if you do not have enough from staking, you pay by burning trx. token terminal’s q2 report describes this as a 100 percent take rate: fees are paid by burning trx, except where staked resources cover them. tron dao’s q1 report put revenue near 600 million dollars annualized. @coindesk research put q2 fees at about 89 million dollars, second only to hyperliquid. the gap between those two figures is definitional (what counts as revenue) and also reflects the august 2025 governance vote that cut energy prices by about 52 percent to make the chain cheaper.
the reason the number is what it is: tron is the cheapest and busiest place to move tether. that demand is not going away, and it does not depend on crypto trading sentiment the way perps and memecoins do.
will it continue. the usdt part, almost certainly. the burn part is the problem, and it is the reason tron ranks fourth rather than first.
the equation. in q2 2026, tron minted about 3.92 million trx per day and burned about 2.96 million. annualized: about 1.43 billion minted, about 1.08 billion burned. no unlocks. k is 1.
1.08 ÷ 1.43 = 0.76. the burn covers about three quarters of issuance. circulating supply rose about 87 million to 94.85 billion in q2, about 0.4 percent a year.
what people are saying. token terminal’s tron q2 report, published as an x article, notes that network revenue returned to quarterly growth after the fee cut normalization, and that transaction count, throughput, and stablecoin supply all set new highs. post:
the catch. “deflationary trx” is one of the most repeated lines in crypto and it has been false for three consecutive quarters. the fee cut made tron cheaper, which brought more usage, but each transaction now burns less, and more users pay with staked resources instead of burning at all. analysts expect the burn to cross back above issuance sometime in 2027 if usdt keeps growing. that is a reasonable expectation. it is not the same as owning a deflationary asset today.
5. sky | bcr about 0.7 to 1.3 | roughly flat, direction set by governance
what it is. sky, formerly makerdao, issues the usds stablecoin (and still runs dai). it is the oldest large defi protocol still operating.
How it makes money and why: Sky generates revenue from three main sources. Borrowers pay stability fees when they take out USDS loans against collateral. The protocol also earns yield from real-world assets, mainly Treasury bills, that back a large share of USDS. In addition, Sky collects fees from modules that help maintain USDS’s peg.
Sky’s official account reports more than $400 million in revenue over the past twelve months, while Grayscale’s Artemis-based list puts the figure at about $248 million. The difference comes down to accounting: Sky reports gross revenue before paying the savings rate to USDS holders, whereas Artemis measures revenue after those payments.
In Q1 2026, Sky generated $124 million in gross revenue and $61 million in net revenue, marking its strongest quarter.
why the number is what it is: usds supply is over 9 billion and treasury yields are still above 3.5 percent. that is a large, steady base. it does not depend on trading volume. it is the most durable revenue on this list.
will it continue. the revenue, very likely. the buyback, only as long as governance wants it to. that is the whole story with sky.
The equation: Allium recorded about $26 million in SKY buybacks between January and August 2026. That figure annualizes to roughly $39 million, or approximately 520 million SKY at recent prices.
On the supply side, an August 13 executive vote set staking rewards at about 96.9 million SKY over 90 days, equivalent to roughly 393 million SKY annually. The same vote determines how Sky handles its buybacks: each Smart Burn Engine cycle directs 55% toward SKY purchases and 45% toward LSSKY stakers. The protocol may then burn the purchased SKY or distribute it to holders.
This uncertainty puts (k) between 0.5 and 1, depending on whether Sky holds the purchased tokens or permanently removes them from circulation.
at k = 0.5: (0.5 × 520) ÷ 393 = 0.66. at k = 1: 520 ÷ 393 = 1.32.
sky is flat, and which side of flat it sits on is decided by a governance parameter.
what people are saying. in august sky’s account announced that buybacks were scaling back up as staking rewards moved from treasury-funded to revenue-funded, describing it as stage 2 of the framework published in april: build reserves first, then return to holders. post:
the catch. in march, sky cut the daily buyback allocation from 300,000 to 37,600 usds, an 87.5 percent reduction, to build a 150 million dollar solvency reserve. it also cut the savings rate from 4.75 to 3.60 percent. those were defensible decisions. they also mean the holder’s share of revenue went from large to small to medium within six months, on three votes. sky has the best revenue and the most changeable mechanism on this list.
6. pump (@pumpfun) | bcr about 0.31 | supply growing about 14 percent a year
what it is. pump.fun is the memecoin launchpad on solana. anyone can create a token in seconds; pump.fun takes a fee on every trade on its bonding curve and on its own exchange, pumpswap.
how it makes money and why. about 459 million dollars in the twelve months to june per grayscale’s list, on a market cap of about 456 million at the time, a 1x multiple. that is the second highest revenue on the list. the reason is simple: memecoin launches happened at enormous scale on solana in 2025 and pump.fun collected a fee on nearly all of them. pump.fun was the first solana platform to pass 1 billion dollars in cumulative revenue.
will it continue. this is where pump is different from everything above it. revenue is falling fast. about 971 million dollars in 2025, about 125 million in q1 2026, and the current run rate is somewhere between 322 and 450 million depending on the window. the business tracks memecoin mania, which has faded from its peak.
the equation. on april 28, pump.fun burned every token it had previously bought, about 370 million dollars worth and about 36 percent of circulating supply, and launched a locked contract that sends 50 percent of net revenue to buy and burn pump for one year. trailing burn about 25.7 billion pump. scheduled unlocks about 82.2 billion, from team and investor allocations that started unlocking in july. k is 1.
25.7 ÷ 82.2 = 0.31. the burn covers about a third of the new supply. net supply grows about 14 percent a year.
what people are saying. pump.fun‘s own announcement said the full burn was done “to gain trust with our community” and set the 50 percent programmatic burn for the following year. post:
The catch: Three factors could push PUMP’s actual coverage ratio below 0.31. First, falling revenue could reduce next year’s buyback compared with last year’s. Second, Pump.fun cut the share of revenue allocated to buybacks from 100% to 50% in April. Third, insiders unlocked about $135 million worth of tokens in mid-July, equivalent to roughly 21% of the circulating supply.
Despite spending more than $300 million on buybacks, PUMP has fallen about 78% from its September 2025 peak. This example shows why investors must look beyond the burn itself. A buyback can remove tokens from circulation, but a shrinking business and a large wave of incoming supply can still put significant pressure on the token’s price.
7. @aave | bcr about 0.12 to 0.24 | supply growing about 2.5 percent a year
what it is. aave is the largest lending protocol in defi. people deposit assets to earn interest and borrow against collateral.
how it makes money and why. aave keeps a slice of the interest borrowers pay (roughly 15 percent of the spread, per one analysis) plus liquidation fees, flash loan fees, and interest on its own stablecoin, gho. grayscale’s list shows about 125 million dollars in the twelve months to june. aave’s founder put dao revenue at about 134 million annualized in june. the reason the number is what it is: aave has the deepest lending markets across the most chains, so it earns a steady spread on tens of billions of dollars of deposits. that is a more stable base than trading fees but it depends on tvl, and tvl took a hit this year.
Will it continue? Probably, but Aave’s buybacks may remain below their pre-April levels. On April 18, the Kelp DAO bridge exploit allowed an attacker to use unbacked rsETH as collateral and borrow about $190 million in real assets. Although Aave’s own contracts did not cause the exploit, the protocol froze markets and estimated bad debt at between $124 million and $230 million. Its TVL then plunged from about $26 billion to below $19 billion within days. Revenue fell alongside TVL, forcing Aave to pause buybacks from April 19.
The equation: Aavenomics 3.0 launched on June 27 and made buybacks automatic. Protocol and GHO revenue now funds open-market AAVE purchases without requiring a separate governance vote for each cycle. The mechanism will continue until governance votes to stop it.
Reported purchases amount to about 292 AAVE per day, or roughly 107,000 AAVE annually. However, Aave sends the purchased tokens to its ecosystem reserve rather than a burn address, so (k = 0.5). Meanwhile, the ecosystem reserve releases about 450,000 AAVE annually, adding more supply than the current buyback removes under this formula.
(0.5 × 107,000) ÷ 450,000 = 0.12. if you count held tokens as fully removed, 0.24. net supply grows about 2.5 percent on roughly 16 million circulating.
what people are saying. aave’s founder described the change as a move to immutable and automated buybacks, and said 100 percent of aave and gho revenue now flows to the token. post:
the catch. aave has one of the largest and most reliable revenue bases in defi, and the mechanism is now the kind that cannot be quietly switched off. but on the supply question it is mildly diluting, because the buyback is small relative to reserve releases and it holds rather than burns. the earlier committee-run program bought at an average of about 182 dollars per aave and the token later traded near 90, leaving about 23 million dollars of paper losses. good business, credible mechanism, weak ratio.
8. hype (@hyperliquidx) | bcr about 0.12 | supply growing about 47 percent a year
what it is. hyperliquid is a perpetual futures exchange that runs on its own blockchain. it is where most onchain leverage trading happens.
how it makes money and why.
trading fees. token terminal measured 178.7 million dollars in revenue in q1 2026, about 96 percent of it from trading. grayscale’s twelve month figure is 871 million dollars, the largest of any onchain app. the reason is market share: hyperliquid holds roughly 60 to 80 percent of decentralized perp volume, processed about 633 billion dollars in q1 alone, and had about 14 billion dollars of open interest in early september. it earns the fees a centralized exchange would earn, onchain, and it keeps almost all of them.
will it continue. as long as people trade. that is the strength and the weakness. hyperliquid’s fee base is the most cyclical on this list after pump.fun. in a quiet market, fees fall and the buyback falls with them. in a busy one, both rise. the october 3 launch of aqa v2 adds a second source: about 90 percent of the yield earned on the protocol’s usdc reserves will flow into the same buyback, estimated at 135 to 160 million dollars a year, and that part does not depend on trading volume.
the equation. roughly 97 to 99 percent of fees go to the assistance fund, which buys hype continuously on the open market. since a december 2025 validator vote, the fund’s holdings are recognized as burned, so k is 1. trailing recurring burn about 14.3 million hype (after removing the one-time december recognition). scheduled unlocks about 119 million hype over the next twelve months, mostly core contributor vesting.
14.3 ÷ 119 = 0.12. adding the aqa v2 estimate at recent prices moves it to about 0.14. net supply grows about 105 million on about 222 million circulating, roughly plus 47 percent.
what people are saying. the hyper foundation’s december post confirmed the assistance fund’s holdings were formally recognized as burned, with 85 percent of stake voting in favor. post:
the catch. this is the best buyback mechanism in crypto. it is fee-funded, automatic, verifiable, and it ends in a burn. and it is still losing to the unlock by about eight to one. only about a fifth of supply circulates, which is why hype trades at about 15 times trailing revenue on market cap but about 70 times on fully diluted value. the buyback slows the dilution. it does not reverse it. anyone calling hype deflationary is describing the mechanism, not the supply.
9. lit (@lighter_xyz) | bcr not yet calculable, likely below 0.4 | supply growth unknown, likely large
what it is. lighter is a perpetuals exchange built as a zero-knowledge rollup on ethereum. it competes directly with hyperliquid.
How it makes money and why: Lighter generates revenue from trading fees, much like Hyperliquid. Grayscale’s list reports about $50 million in revenue over the twelve months to June, alongside cumulative perpetual futures trading volume of more than $1.6 trillion.
Lighter charges very low fees to attract traders away from Hyperliquid. This pricing strategy helps the platform capture volume, but it also means Lighter needs substantial trading activity to generate $50 million in revenue.
Will it continue? The perpetual futures market is growing, and Lighter is one of the two or three venues that matter. Revenue could remain strong if trading volume holds. The bigger risk is not the business itself, but the token unlock schedule.
The equation: Lighter buys LIT daily with protocol revenue. Following a policy change in June, it began burning all the tokens it purchases. On July 10, the first burn permanently removed 15,638,702 LIT, equivalent to about 6.3% of the circulating supply. Lighter published the Ethereum transaction hash as proof.
The project’s account later reported that Lighter had bought back 17.5 million LIT since launch, representing about 7% of the circulating supply. At the recent pace, that equates to roughly 26 million LIT in annual buybacks. Because Lighter permanently burns every purchased token, (k = 1).
On the supply side, staking rewards now come from the ecosystem reserve at a rate of about 7.5 million LIT per year. The bigger concern is vesting. About 66% of LIT’s maximum supply of 1 billion tokens remains locked, with unlocks beginning in late 2026. The first major unlock cliff is expected around December. I could not find a published figure for the total unlocks over the next twelve months.
The coverage ratio tells two different stories.
The December unlock cliff will determine which figure better reflects LIT’s actual supply pressure. Strong buybacks look impressive against staking emissions alone, but they may not offset substantial investor and team unlocks.
What people are saying: Lighter’s account confirmed the burn, published the exact amount, and stated that the tokens had been permanently removed from circulation.
Post:
the catch. market cap was about 461 million dollars at the end of june against a fully diluted value of about 1.84 billion. the 6.3 percent burn is against 250 million circulating, but only about 1.6 percent of max supply. lighter has also said it may burn undistributed lit rather than the exact tokens it bought, which is economically equivalent but means the burn address does not directly trace the buyback. this is the row that most needs one number nobody has published yet.
10. aero (@aeroxyz) | bcr about 0.17 | supply growing about 8 to 10 percent a year
What it is: Aerodrome is the leading decentralized exchange on Base, Coinbase’s Layer 2 network. It handles about 60% of Base’s DEX trading volume.
How it makes money and why: Aerodrome generates revenue from swap fees and voting incentives. Grayscale’s list reports about $124 million in revenue over the twelve months to June. Base grew rapidly during this period, and Aerodrome captured most of its DEX trading activity. That included providing day-one liquidity for Coinbase’s tokenized stocks in August. Between its launch in August 2023 and April 2026, Aerodrome distributed more than $450 million to token holders.
The unusual part is how Aerodrome distributes that revenue. The protocol retains none of it. Instead, it pays 100% of fees and incentives to users who lock AERO for up to four years and vote on which liquidity pools receive emissions. This makes Aerodrome the clearest revenue-sharing model on the list.
However, these payments do not reduce AERO’s supply. Users receive the assets being traded, such as USDC and ETH, rather than AERO itself. The model rewards token holders with revenue but does not directly support AERO through buybacks or burns.
Will it continue? Yes, provided Base maintains its trading volume. The proposed merger with Velodrome into a unified AERO protocol, along with a potential expansion to Ethereum mainnet, could create additional revenue opportunities. However, the migration status had not been confirmed at the time of writing.
The equation: The Momentum Fund pilot bought about 8.7 million AERO, averaging roughly 670,000 AERO per weekly epoch. If that pace continues, it would annualize to approximately 35 million AERO. The fund holds the purchased tokens rather than burning them, so (k = 0.5).
On the supply side, AERO’s annualized emissions stood at about 10.9% as of April. That equates to roughly 100 million AERO per year against a circulating supply of approximately 928 million. No additional unlocks are scheduled beyond emissions, but around half of the 1.87 billion total supply still remains to be distributed.
(0.5 × 35) ÷ 100 = 0.17. net supply grows about 8 to 10 percent a year.
what people are saying. aerodrome’s account described the momentum fund as a counter-cyclical buyback that buys more when volatility is high, and reported that in one epoch it acquired 27.5 percent of all weekly emissions. post:
the catch. aerodrome pays real cash yield and dilutes at the same time. castle labs found the net value to aero holders was negative in the first half of 2026 once emissions were counted. that is not a failure; it is a different design. the ve model pays you in cash and asks you to accept a growing supply. this equation only measures the supply. if you want cash yield, aerodrome is near the top of a different list.
Now that we have identified the ten protocols with the strongest buyback and burn profiles relative to their token emissions, it is time to stretch the numbers over a longer period. Let’s use ten years. By then, hopefully, you will have realised some profits and be getting your back massaged somewhere in the Bahamas. Sounds good, right?
Everything above is a snapshot. It compares this year’s buybacks with next year’s unlocks to produce a single number. That works for ranking tokens today, but it can mislead you over longer periods. Unlocks eventually end, while buybacks can continue.
So, let’s run the same equation year by year instead of calculating it just once. Each year’s supply projection accounts for the published unlock schedule, emission rate, supply cap, and token burns.
This approach captures how the numbers change over time. The ratio can fall sharply during a major unlock year, then climb well above 1 once those unlocks end. That is the key difference between a snapshot and a long-term model, and it changes the outlook for four of the ten tokens.
circulating supply, base path, 2026 to 2036
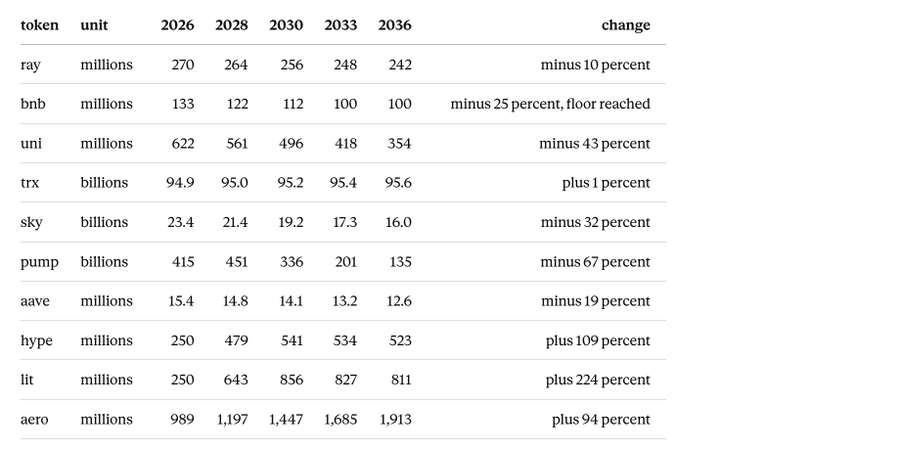
source: external scenario workbook dated september 11, 2026 ( me and chatgpt doing 4 hours of maths on circulating supply emissions over 10 years) base path only. bear and bull paths differ mainly in burn size and, for aero, in the emission rate.
what each row means.
RAY: RAY’s float shrinks slowly. The 12% fee allocation continues to fund buybacks, while emissions remain small. The model projects a roughly 10% decline in the float over ten years. However, Raydium holds the purchased tokens rather than burning them. This projection therefore measures circulating float, not total supply.
BNB: BNB has the clearest supply outlook. The Auto-Burn and real-time fee burns reduce supply from about 133 million to the 100 million floor around 2033. Once BNB reaches that threshold, the burns stop. Supply then remains fixed. Of all the tokens in this model, BNB has the most predictable 2036 supply.
UNI: UNI shows the largest projected supply reduction among tokens that have completed their unlock schedules. No tokens remain to unlock, and fee-funded burns reduce supply from a fixed base. If trading volume holds, the model projects a roughly 43% decline in supply by 2036. However, that outcome rests on a major assumption: Uniswap must sustain the current level of fees from Robinhood Chain for another decade.
TRX: TRX’s supply remains almost flat. The token has no hard cap or scheduled unlocks. Current burns fall slightly short of issuance, but the model expects burns to overtake issuance around 2027. Either way, the projected ten-year supply change is only about 1%.
SKY: SKY’s supply falls by roughly one-third in the model. However, this outcome depends entirely on the governance parameter that determines whether the protocol burns purchased SKY or distributes it to stakers. The model assumes that burning prevails. If stakers receive the tokens instead, supply remains roughly flat.
PUMP: PUMP follows a hill-shaped supply curve. Supply rises until around 2029 as team and investor tokens unlock. After that, the 50% buyback allocation could begin to outweigh new supply, provided the program continues beyond its initial one-year term. The model projects that PUMP’s supply will fall by about two-thirds by 2036. However, this outcome depends on one key assumption: launchpad revenue must remain strong enough to fund buybacks over the long term.
AAVE: AAVE has already issued almost all its tokens. Ecosystem reserve releases are small and finite, while automated buybacks can continue. As a result, the model projects a roughly 19% decline in supply. AAVE is therefore less of a supply story and more of a bet on future revenue and the valuation multiple the market assigns to the protocol.
HYPE: HYPE does not face perpetual dilution. Its remaining 466 million locked tokens unlock along a declining curve through around 2034, within a maximum supply of 1 billion. Supply roughly doubles to 540 million by 2030 before buybacks begin to outweigh new supply. The earlier figure of 47% annual growth applies to the vesting period, not the entire ten-year forecast. The key years are 2027 to 2029, when HYPE must absorb the largest wave of unlocks. After that, the assistance fund could help drive supply lower.
LIT: LIT follows a similar pattern to HYPE, but the pressure is more concentrated. The years from 2027 to 2029 are the most difficult. Around 500 million insider tokens, alongside ongoing ecosystem releases, could enter circulation against a float of just 250 million. After 2030, new supply drops sharply. A single ten-year average would obscure this front-loaded dilution and understate the pressure LIT faces in its early years.
AERO: AERO never reaches a final supply level under the model’s assumptions. Emissions remain tied to a percentage of supply, and the token has no hard cap. Circulating supply therefore rises in every scenario. It grows faster in the bear case, at around 12% annually, and more slowly in the bull case, at around 7%, if AERO’s veAERO voters tighten emissions. The current buyback coverage ratio cannot resolve this uncertainty. AERO’s long-term outlook depends on how voters manage emissions.
the scenario prices, and what they are
the workbook then does one more step. it grows each protocol’s revenue year by year on three paths (bear, base, bull), applies a capture rate and an exit multiple, and divides the 2036 value by the 2036 supply from the table above. that gives a 2036 price per token.
2036 price = 2036 network or token value ÷ 2036 circulating supply
these are not my targets. they are what falls out when you put one supply path next to one revenue path. change the multiple and every number moves higher.
i am including them because the arithmetic is transparent and because the ranking they produce is different from every other ranking in this article, which is the useful part.
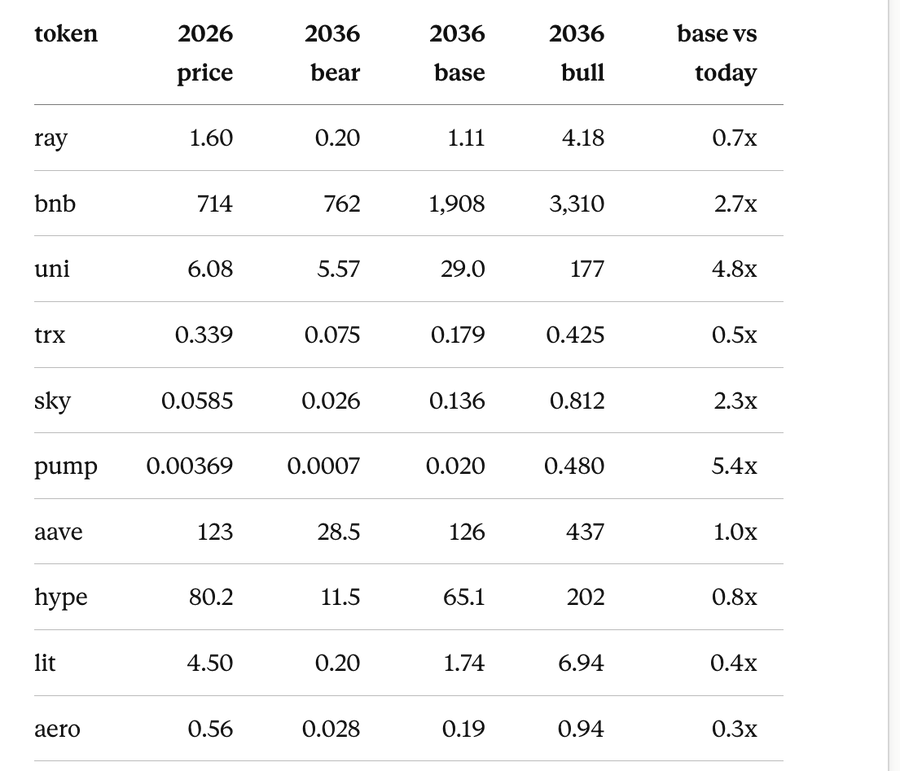
all prices in dollars. source: external scenario workbook, september 11, 2026.
bnb is modelled as a market cap path times scarcity; trx as chain fees times a multiple; the rest as revenue times capture times multiple.
what the base case ranking says, in one line each
Compare these results with the ranking at the top of the article. Raydium ranks first by today’s BCR but seventh in the 2036 projections. Pump ranks sixth by today’s BCR but first in the long-term forecast. This is not a contradiction.
Today’s ratio shows where each token stands on its vesting curve. The ten-year model looks beyond that curve to estimate the remaining supply. HYPE, LIT, and PUMP look weak today because they still face major unlocks. Once those unlocks end, their buybacks have less new supply to offset. That could improve their long-term outlook if the burns continue.
why you should not trust the prices,
The supply table offers the most reliable part of the model. Published unlock schedules help us estimate future token supply with greater precision. Revenue is much harder to predict.
Every 2036 price projection depends on two assumptions. How much revenue will each protocol generate? What valuation multiple will the market assign to it? Even the model’s author admits that the multiples are “not sacred.”
Use this table to understand future dilution, not to predict exact prices. Focus on which tokens may still face dilution in 2034 and which could finish their unlock schedules earlier. That is the more useful insight for long-term investors.
although i have three specific holes.
>the model counts hype and lit circulating supply as unlocked tokens rather than exchange-reported circulating, so the 2026 starting points are above what defillama shows.
> the pump community allocation is not cleanly scheduled. and sky’s burn is a governance parameter that has changed three times this year, so the sky row is a policy assumption disguised as a supply path.
the ones that scored zero or could not be scored your favourite alts don’t come for me please
ASTER: Aster directs 99% of its fees toward buying ASTER for veASTER stakers. Since stakers receive the tokens, (k = 0).
A separate program aims to reduce supply toward 3 billion ASTER by burning team and reserve allocations. However, Tokenomist recorded about 99.9 million tokens burned between January and May, with no further burns since then. The project has also spent only about $4 million of its announced buyback total on open-market purchases.
ASTER faces roughly 637 million scheduled unlocks over the next twelve months. Its BCR stands at 0, while net supply grows by about 24%.
ENA (Ethena): Ethena overhauled its tokenomics in August. The changes bought out early investors and ended monthly investor unlocks, leaving one final release on October 5. The project also proposed directing 95% of net revenue from eligible business lines toward buybacks.
However, the buyback program has a condition. USDe supply must reach $7.5 billion before purchases begin. Supply stood at about $4.07 billion on August 30. Until USDe reaches that threshold, (b = 0), leaving ENA with a BCR of 0.
JUP (Jupiter): Grayscale reports about $130 million in revenue, making Jupiter one of the largest protocols on the list. The project directs 50% of that revenue toward buying JUP for the Litterbox Trust. The trust holds those tokens, so (k = 0.5).
Tokenomist lists no scheduled unlocks over the next twelve months. Under the formula, JUP technically passes because it has no scheduled supply to cover. However, several uncertainties remain. A co-founder proposed halting the program in January, and the trust has burned tokens only once. The annual Jupuary airdrop also adds supply outside the vesting schedule. These uncertainties make JUP difficult to rank reliably.
PENDLE: Pendle pays about 80% of its revenue to sPENDLE stakers as cash yield. It does not buy back or burn PENDLE. Around 4.6 million tokens face scheduled unlocks, giving the token a BCR of zero. Like Aerodrome, Pendle offers a dividend-style model rather than a direct supply reduction.
PancakeSwap (CAKE): Grayscale reports about $322 million in revenue against a market cap of $425 million. CAKE also runs a long-standing buyback-and-burn program. However, I could not find comparable figures for forward unlocks and trailing burns. For that reason, I have left CAKE unranked. It deserves a place in the next version of this list.
what the ranking says
the order is not the order the timeline would give.
raydium, which has never made a tokenomics announcement, is first. hyperliquid, which runs the best buyback in crypto, is eighth. that is not a judgment about which protocol is better. it is what happens when you put the unlock schedule next to the burn dashboard instead of looking at the burn dashboard alone.
three lessons.
first, revenue size and holder outcome are almost unrelated. hyperliquid, pump.fun, and sky are the top three by revenue on grayscale’s list. they rank eighth, sixth, and fifth here. bnb and raydium, which have no revenue-share story at all, rank second and first, because they have nothing to dilute.
Second, reliable mechanisms matter more than bigger ones. Sky’s BCR moved above 1, fell below it, and rose again after three governance votes. Aave paused buybacks for two months. Pump also cut its allocation in half.
Other protocols use more consistent mechanisms. Raydium directs 12% of trading fees to RAY buybacks. Uniswap uses TokenJars, while Hyperliquid relies on its Assistance Fund. BNB follows its burn contract, and Aave now runs automated buybacks. These mechanisms offer greater consistency unless governance changes the rules.
Third, separate token supply from cash yield. Aerodrome and Pendle pay real yield while their tokens continue to dilute. BNB and Raydium reduce supply but pay no direct cash yield. These models serve different investors. The BCR measures supply changes, not every benefit a token offers.
run it on whatever you hold. last year’s burn, times k, divided by next year’s unlocks plus emissions. if the answer is under 1, you are being diluted, and the buyback announcement did not change that.
which of your holdings would you guess scores above 1, and have you checked? i just hope you are able to buy the best alts moving forward
(this is research, not financial advice. every input above has a date and a source, and should be checked on the primary dashboard before you act on it also its only projected on a 1o year timeframe and would produce different numbers ).